Астрахань, Астраханская область, Россия
Россия
Россия
Астрахань, Астраханская область, Россия
Решается задача определения способности жидкости к проникновению в структуру композиционного материала, подготовленного с применением армирующих стеклянных тканей и полиэфирного связующего элемента. Определение способности воды проникать в структуру образцов, нарезанных из общей плиты полимерного композитного материала (ПКМ), производится путем определения изменения веса образцов до и после их погружения в емкости с жидкой средой (вода) на определенный промежуток времени. Установлена способность проникновения воды в состав данного материала в зависимости от его структуры, т. е. от расположения армирующего материала. Представлены механические свойства (предел прочности при растяжении, сжатии и изгибе) композиционного материала после его изъятия из емкости с жидкостью. Решается задача о возможности влияния обработки торцов нарезанных образцов для испытаний полиэфирной смолой на способность проникновения жидкости в состав ПКМ. С этой целью образцы, нарезанные из общей плиты, погружались в емкости с водой, при этом торцы одной партии образцов были покрыты полиэфирной смолой, а другая партия оставалась без покрытия. Установлено влияние нахождения образцов в жидкой среде (вода) с определенным соотношением слоев армирующего материала (стекломата и ровинговой стеклоткани) на их механические характеристики при изгибе, растяжении и сжатии. Приведены результаты испытаний образцов, которые показали прямую зависимость предела прочности и разрушающей действующей силы от количества ровинговых слоев в структуру ПКМ у образцов края, которые были обработаны полиэфирной смолой. В ходе выполнения экспериментов определена способность проникновения жидкости в структуру композиционных материалов и изменения механических свойств в результате погружения данных материалов в жидкую среду. Полученные результаты экспериментальных испытаний образцов из ПКМ при различных схемах армирования оправдают их широкое применение в судовых корпусных конструкциях (в частности, как материал для изготовления судовых цистерн).
судовые цистерны, полимерные композитные материалы, вода, армирующий материал, связующий элемент, проникающая способность, предел прочности, прилагаемая нагрузка, разрушающая нагрузка
Introduction
The widespread use of products made of polymer composite materials (PCM) in the field of shipbuilding is explained by their high mechanical characteristics compared to products made of steel, in particular, specific strength, as well as the possibility of obtaining finished products without the use of traditional expensive mechanical treatments, etc. [1].
Fiberglass is a composite material consisting mainly of a fiberglass filler and a polymer matrix (binder) that combines the filler into a single homogeneous composition. Fiberglass based on polyester and vinyl ester resins is a structural material capable of withstanding all types of loads, including shock and vibration. According to its physical characteristics, fiberglass is considered resistant to many aggressive liquids, insoluble and non-melting, has high chemical resistance, low water absorption and an environmentally friendly product. One of the main advantages of composite materials is their minimal conductivity, which provides high protection against fire. Composite materials have high maintainability, low weight, biological resistance, structural rigidity, durability and impact resistance [2].
The purpose of this study is to determine the effect of water on the weight and mechanical properties of samples made of PCM with treated and untreated edges with polyester resin when they are immersed in a liquid with a sustained period of time. Determination of the influence of the location of reinforcing layers (glass wool and roving fiberglass) on the ability of liquid penetration into the structure of the composite material. The object of the study is six layered samples with treated and untreated edges with polyester resin, made of composite materials using glass fabrics and with a different arrangement of reinforcing materials and a different quantitative ratio of layers.
Methods of manufacturing and testing samples from PCM
For further experiments, plates were made of PCM of two different reinforcement schemes, from which samples were subsequently cut using a milling machine and a sawtooth disk made of hardened steel. The samples from the PCM were made for testing for three-point bending, compression and stretching.
The pattern of reinforcement of the samples is as follows:
– scheme I: glass wool, glass wool, roving fiberglass, roving fiberglass, glass wool, glass wool;
– scheme II: roving fiberglass, roving fiberglass, glass wool, glass wool, roving fiberglass, roving fiberglass.
The samples from each scheme were divided into two groups:
– the first group, samples without edge treatment with polyester resin;
– the second group, samples with polyester resin edge treatment.
The edges of the samples of the second group are treated with polyester resin Yaropol 110, using a brush with natural bristles. After processing the edges of the samples, they must be left for 48 hours at normal room temperature, only after complete drying, the processed samples are weighed, immersed in water for 90 days at room temperature 23 °C and humidity 50%. Table 1 shows the weight characteristics of samples with different reinforcement schemes [3].
Table 1
Weight characteristics of samples before soaking in water
|
Reinforcement scheme
Sample number |
Samples without edge treatment with polyester resin |
||||||||
|
For tensile testing |
For compression testing |
For bending test |
|||||||
|
I |
II |
I |
II |
I |
II |
||||
|
Weight, g |
|||||||||
|
|
|
1 |
54.12 |
44.74 |
0.71 |
0.68 |
34.71 |
27.77 |
|
|
|
|
2 |
55.37 |
42.55 |
0.64 |
0.60 |
35.26 |
27.79 |
|
|
|
|
3 |
50.93 |
44.09 |
0.72 |
0.74 |
35.57 |
28.11 |
|
|
|
|
4 |
51.71 |
42.24 |
0.70 |
0.56 |
35.65 |
30.76 |
|
|
|
|
5 |
54.35 |
44.06 |
0.60 |
0.63 |
35.33 |
30.51 |
|
|
Average values |
53.296 |
43.536 |
0.674 |
0.642 |
35.304 |
28.988 |
|||
|
Samples with edge treatment with polyester resin |
|||||||||
|
|
|
1 |
55.06 |
43.98 |
0.85 |
0.84 |
36.11 |
31.11 |
|
|
|
|
2 |
54.82 |
43.53 |
0.74 |
0.79 |
36.37 |
27.83 |
|
|
|
|
3 |
58.09 |
45.19 |
0.76 |
0.72 |
35.94 |
30.63 |
|
|
|
|
4 |
59.32 |
44.26 |
0.80 |
0.77 |
35.62 |
28.94 |
|
|
|
|
5 |
59.32 |
43.29 |
0.89 |
0.83 |
35.58 |
29.51 |
|
|
Average values |
57.322 |
44.05 |
0.808 |
0.79 |
35.924 |
29.604 |
|||
Samples from PCM of different reinforcement schemes are weighed before immersion in water on certified equipment of the laboratory of Ship Mechanical Disciplines of the Caspian Institute of Marine and River Transport named after General-Admiral F. M. Apraksin.
After the expiration of the specified period of time, samples of different reinforcement schemes are removed from the water, wiped dry with a cotton cleaning cloth and weighed (Table 2) on certified laboratory electronic scales of the VLTE-310T series [4].
According to the measurement results of the average mass values of the samples of the two reinforcement schemes without edge treatment before and after soaking in water, it was found:
– the increase in the masses of the samples intended for tensile tests of the I and II reinforcement schemes is 0.556 and 0.3 grams, respectively;
– the increase in the mass of samples intended for compression tests of the I and II reinforcement schemes is 0.004 and 0.012 grams, respectively;
– the increase in the mass of samples intended for bending tests of the I and II reinforcement schemes is 0.342 and 0.198 grams, respectively.
The results of measuring the average mass values of samples of two reinforcement schemes with edge treatment with polyester resin before and after soaking in water showed that the average values of changes in the weight parameters of the samples increase, but at the same time:
– for samples prepared for tensile tests, the increase in the average weight values of I and II reinforcement schemes is 1.084 and 0.654 grams, respectively;
– for samples intended for compression tests, this increase is 0.0044 and 0.042 grams;
– for samples intended for bending tests, the increase in the average values of weight characteristics is 0.966 and 0.39 grams.
Table 2
Weight characteristics of samples after soaking in water
|
Reinforcement scheme
Sample number |
Samples without edge treatment with polyester resin |
|||||||
|
For tensile testing |
For compression testing |
For bending test |
||||||
|
I |
II |
I |
II |
I |
II |
|||
|
Weight, g |
||||||||
|
|
|
1 |
54.59 |
45.04 |
0.71 |
0.69 |
35.06 |
27.98 |
|
|
|
2 |
55.93 |
42.83 |
0.65 |
0.61 |
35.59 |
27.97 |
|
|
|
3 |
51.49 |
44.41 |
0.73 |
0.75 |
35.90 |
28.32 |
|
|
|
4 |
52.36 |
42.53 |
0.70 |
0.57 |
36.02 |
30.96 |
|
|
|
5 |
54.89 |
44.37 |
0.60 |
0.65 |
35.66 |
30.70 |
|
Average values |
53.852 |
43.836 |
0.678 |
0.654 |
35.646 |
29.186 |
||
|
Samples with edge treatment with polyester resin |
||||||||
|
|
|
1 |
56.05 |
44.59 |
0.89 |
0.89 |
37.08 |
31.40 |
|
|
|
2 |
55.74 |
44.03 |
0.78 |
0.83 |
37.28 |
28.15 |
|
|
|
3 |
59.17 |
45.91 |
0.80 |
0.75 |
36.84 |
31.02 |
|
|
|
4 |
60.41 |
45.01 |
0.85 |
0.81 |
36.66 |
29.49 |
|
|
|
5 |
60.66 |
43.98 |
0.94 |
0.88 |
36.59 |
29.91 |
|
Average values |
58.406 |
44.704 |
0.852 |
0.832 |
36.89 |
29.994 |
||
Based on the conducted studies, it follows (Fig. 1) that, lead has good penetrating abilities, causes swelling, accompanied by an increase in mass, volume, most noticeable on samples from PCM with treated edges with polyester resin [5].
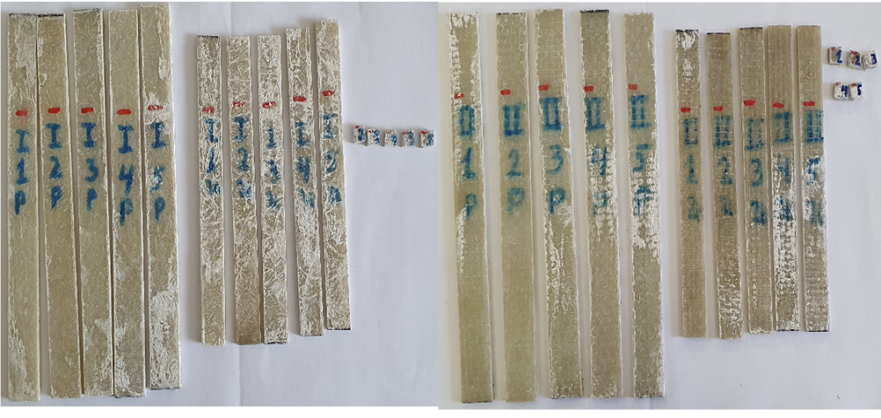
Fig. 1. Samples from the PCM of two reinforcement schemes with treated edges
with polyester resin after soaking in water
Tests of samples from PCM in order to determine their mechanical characteristics after soaking in water were carried out on certified testing machines at the Department of Ship-Mechanical Disciplines of the Caspian Institute of Marine and River Transport named after General-Admiral F. M. Apraksin.
Testing of samples from PCM for three-point bending
On the basis of regulatory and technical documentation, test samples are produced. Testing of samples from PCM for static bending is carried out in accordance with USS 4648-2014, samples are made of rectangular shape with dimensions of length and width 200 × 20 mm (Fig. 2, 3) [6].
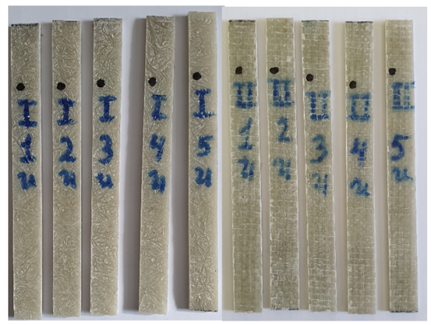
Fig. 2. Samples of two different reinforcement schemes without edge treatment with polyester resin
for the three-point bending test
According to the average thickness of the samples according to the formula L = (16 ± 1)h, the distance between the supports is determined. The test samples are placed on supports and subjected to three-point bending at a constant loading rate until complete destruction, while measuring the destructive load applied to the sample [7]. The applied load is fixed at 10 mm/min. The bending strength of the PCM is calculated by the expression:
![]()
where Fmax – is the value of the loading force, N; L – is the fixed distance between the installed supports, mm; b – is the size of the sample in width, mm; h – thickness of the sample, mm.
The fixed distance between the installed supports is calculated using the formula
L = (16 ± 1)h.
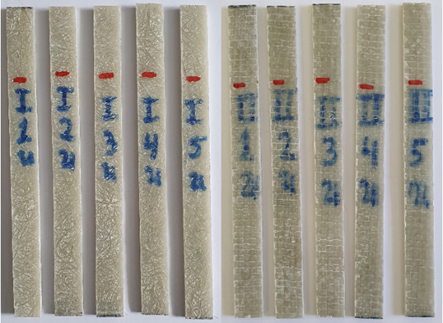
Fig. 3. Samples of two different reinforcement schemes from the edge treatment with polyester resin to the three-point bending test
Table 3 shows the results of testing samples from PCM for three-point bending.
Table 3
Test results of samples from PCM for three-point bending
|
Sample number |
Reinforcement scheme |
||||||
|
I |
II |
||||||
|
Fmax, kgp |
σ, МРа |
Fmax, kgp |
σ, МРа |
||||
|
Samples without edge treatment with polyester resin |
|||||||
|
|
|
1 |
90 |
177 |
110 |
275.8 |
|
|
|
|
2 |
100 |
200.6 |
95 |
252.5 |
|
|
|
|
3 |
105 |
203.6 |
105 |
248.8 |
|
|
|
|
4 |
110 |
218.4 |
120 |
247 |
|
|
|
|
5 |
115 |
224 |
115 |
250.5 |
|
|
Average values |
104 |
204.72 |
109 |
254.92 |
|||
|
Samples with edge treatment with polyester resin |
|||||||
|
|
|
1 |
95 |
175 |
115 |
304 |
|
|
|
|
2 |
90 |
173.7 |
90 |
243.6 |
|
|
|
|
3 |
85 |
159.5 |
125 |
260 |
|
|
|
|
4 |
85 |
164.8 |
110 |
250 |
|
|
|
|
5 |
100 |
200.5 |
115 |
261 |
|
|
Average values |
91 |
174.7 |
111 |
263.72 |
|||
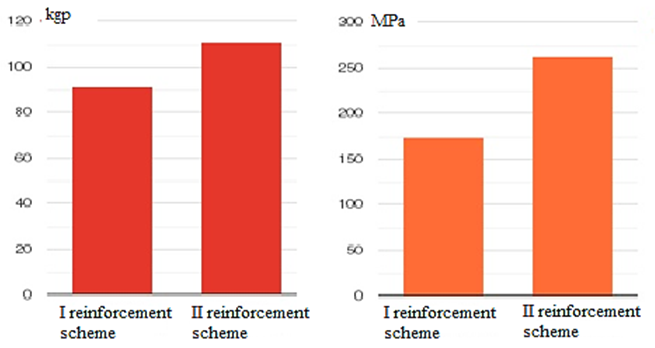
The results of the bending tests carried out show that the average value of the loading force on the samples of the first group (without processing the edges with polyester resin, Fig. 4) after soaking in water is greater than that of the second group (the edges of which are treated with polyester resin), but the average tensile strength of the samples of the second group (the edges of which are treated with polyester resin, Fig. 5) is an order of magnitude higher.
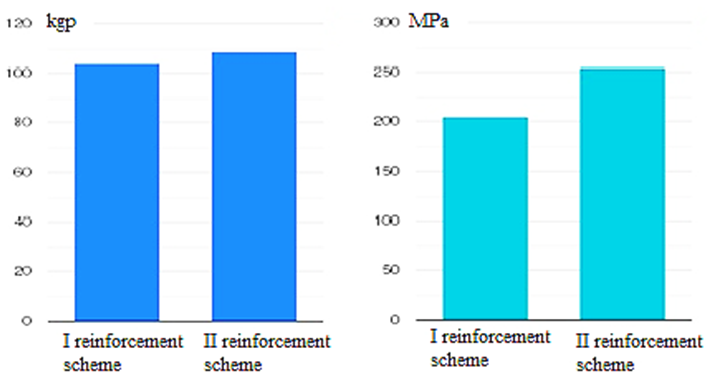
a b
Fig. 4. Graphs of changes in the average values of the destructive forces (а) and strength limits (b)
of samples without processing the edges with polyester resin during the bending test
a b
Fig. 5. Graphs of changes in the average values of destructive forces (a) and strength limits (b)
of samples with edge treatment with polyester resin during bending testing
Tensile testing of samples from PCM
According to USS 11261-17, in order to determine the value of the tensile strength, the samples must have a flat shape with dimensions of 250 mm in length, 25 mm in width and 2 mm in thickness [8]. The tensile strength at PCM is determined by the formula:
![]() (1)
(1)
where A = bh – the cross-sectional area of the sample, mm2.
The test samples (Fig. 6, 7) are stretched along their axis at the same speed of 5 mm/min, the tensile load is measured simultaneously and the breaking load and tensile strength are determined. Table 4 shows the results of tensile testing of samples from PCM.
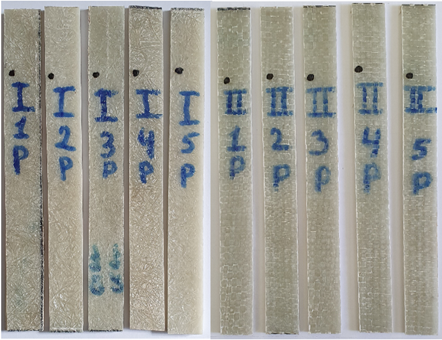
Fig. 6. Samples of two different reinforcement schemes without edge treatment with polyester resin
for tensile testing
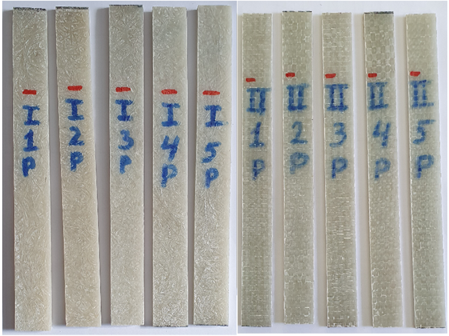
Fig. 7. Samples of two different reinforcement schemes
from the edge treatment with polyester resin
to the tensile test
Table 4
The results of tensile testing of samples from PCM
|
Sample number |
Reinforcement scheme |
|||||||||||
|
I |
II |
|||||||||||
|
Fmax, kgp |
σ, МРа |
Fmax, kgp |
σ, МРа |
|||||||||
|
Samples without edge treatment with polyester resin |
||||||||||||
|
|
|
1 |
2 100 |
147.6 |
2 700 |
227.7 |
||||||
|
|
|
2 |
2 500 |
164.4 |
2 100 |
188.6 |
||||||
|
|
|
3 |
2 350 |
172 |
2 400 |
205 |
||||||
|
|
|
4 |
1 900 |
133.7 |
2 350 |
222.5 |
||||||
|
|
|
5 |
2 600 |
169.8 |
2 250 |
198.8 |
||||||
|
Average values |
2 290 |
198.444 |
2 360 |
208.52 |
||||||||
|
Samples with edge treatment with polyester resin |
||||||||||||
|
|
|
1 |
2 700 |
184.7 |
2 650 |
181 |
||||||
|
|
|
2 |
2 250 |
152 |
2 300 |
203 |
||||||
|
|
|
3 |
2 200 |
144 |
2 100 |
177.5 |
||||||
|
|
|
4 |
2 100 |
130 |
2 250 |
192.6 |
||||||
|
|
|
5 |
2 250 |
138.7 |
2 500 |
227 |
||||||
|
Average values |
2 300 |
149.88 |
2 360 |
196.22 |
||||||||
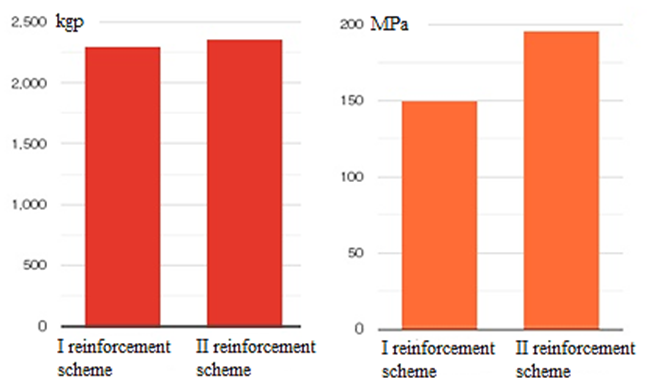
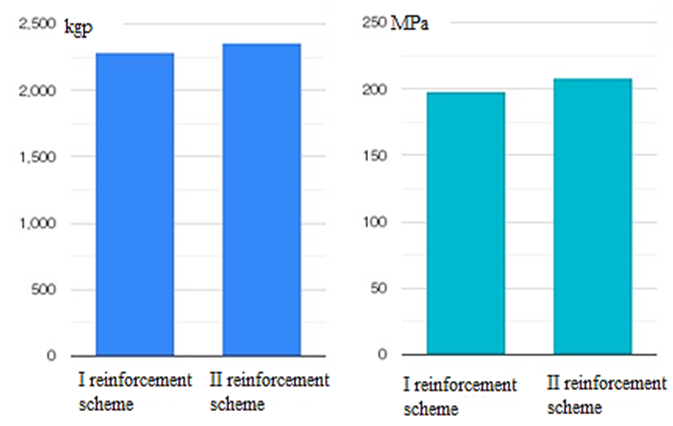
A comparative analysis of the results of the PCM tensile tests shows that the average applied load of the samples of the second group (the edges of which are treated with polyester resin, Fig. 8) after soaking in water is slightly greater or equal to the samples of the first group (without processing the edges with polyester resin, Fig. 9), and the average tensile strength of the samples of the first group (without processing the edges with polyester resin) is an order of magnitude higher.
Compression testing of samples from PCM
According to the requirements of USS 4651-2014, samples intended for compression tests (Fig. 10, 11) are made in a parallelepiped shape with dimensions l × b × h corresponding to 10 × 10 × 4 mm [9].
The loading and compressive force is directed at the samples along the axes, perpendicular to the direction of the reinforcing layers and at a uniform rate until destruction or until the load decreases. It should be noted that the value of the compressive load on the samples is recorded during the entire course of the test. Table 5 shows the results of compression testing of samples from PCM.
a b
Fig. 8. Graphs of the dependence of the average values of destructive loads (a)
and tensile strengths (b) during tensile testing of samples with edge treatment with polyester resin
a b
Fig. 9. Graphs of the dependence of the average values of destructive loads (a)
and tensile strengths (b) during tensile testing of samples without edge treatment with polyester resin

Fig. 10. Samples of two different reinforcement schemes without edge treatment
with polyester resin for compression testing

Fig. 11. Samples of two different reinforcement schemes from processing
the edges with polyester resin for compression testing
Table 5
The results of compression testing of samples from PCM
|
Sample number |
Reinforcement scheme |
|||||||||||
|
I |
II |
|||||||||||
|
Fmax, kgp |
σ, МРа |
Fmax, kgp |
σ, МРа |
|||||||||
|
Samples without edge treatment with polyester resin |
||||||||||||
|
|
|
1 |
2 500 |
474 |
2 600 |
551 |
||||||
|
|
|
2 |
2 900 |
547 |
2 900 |
547 |
||||||
|
|
|
3 |
2 300 |
433.5 |
2 900 |
433.5 |
||||||
|
|
|
4 |
2 100 |
388 |
2 300 |
388 |
||||||
|
|
|
5 |
2 350 |
500.6 |
2 600 |
500.6 |
||||||
|
Average values |
2 430 |
468.62 |
2 660 |
484.02 |
||||||||
|
Samples with edge treatment with polyester resin |
||||||||||||
|
|
|
1 |
2 700 |
482.4 |
2 750 |
552.7 |
||||||
|
|
|
2 |
2 300 |
437.6 |
2 350 |
473 |
||||||
|
|
|
3 |
2 300 |
429 |
2 750 |
562 |
||||||
|
|
|
4 |
2 600 |
476.6 |
2 800 |
568 |
||||||
|
|
|
5 |
2 900 |
513.2 |
2 850 |
578 |
||||||
|
Average values |
2 560 |
467.76 |
2 700 |
546.74 |
||||||||
Samples from the PCM are installed in the center of the support pads of the R-5 testing machine. The uniform speed of the applied load is fixed at a value of 1 mm/min.
The values of the compressive strength of the samples are calculated according to the formula (1).
A comparative analysis of the results of PCM tests for destructive compression load showed that the average values of the applied load and the tensile strength of the samples of the second group (whose edges are treated with polyester resin, Fig. 12) are higher than those of the samples of the first group (whose edges are not treated with polyester resin, Fig. 13).
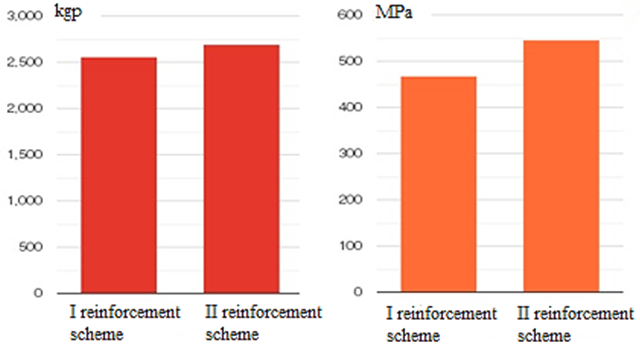
a b
Fig. 12. Graphs of the dependence of the average values of destructive loads (a)
and tensile strengths (b) during compression testing of samples with edge treatment with polyester resin
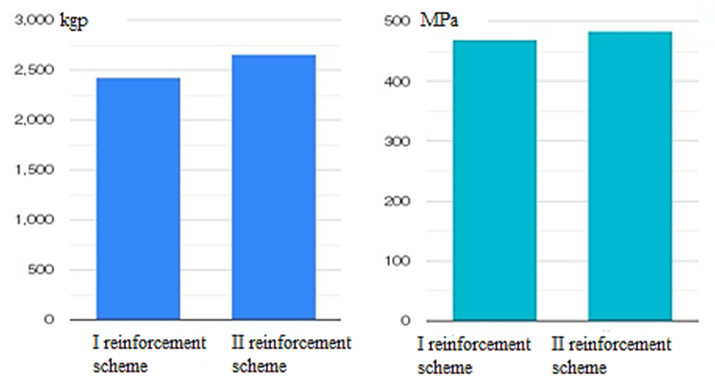
a b
Fig. 13. Graphs of the dependence of the average values of destructive loads (a)
and tensile strengths (b) during compression testing of samples without edge treatment with polyester resin
Conclusion
Based on the results obtained, it can be concluded that the ability of liquid penetration (in this case, water) into the structure of the PCM is influenced by the structure and location of the layers of the composite material, as well as its dimensions. The liquid has a better penetrating ability, especially for samples with small dimensions when the glass wool layer is located outside (scheme I), regardless of whether or not the edges are treated with resin.
The penetration of liquid into the structure of PCM negatively affects their mechanical characteristics by reducing the values of tensile, compressive and bending strengths, while this decrease is less noticeable when the layers of roving fiberglass are located outside.
1. Правила классификации и постройки морских судов. Ч. XVI. Конструкция и прочность корпусов судов из полимерных композиционных материалов. СПб.: Изд-во РМРС, 2019. 151 с.
2. Мелешин М. А., Саламех Али, Алсаид Мазен. Опыт применения композиционных материалов в судо-строении // Вестн. Астрахан. гос. техн. ун-та. Сер.: Морская техника и технология. 2022. № 2. С. 44–50. DOI:https://doi.org/10.24143/2073-1574-2022-2-44-50.
3. Мелешин М. А., Саламех Али, Мамонтов В. А. Технология изготовления образцов из полимерных композиционных материалов // Вестн. Астрахан. гос. техн. ун-та. Сер.: Морская техника и технология. 2023. № 3. С. 19–26. https://doi.org/10.24143/2073-1574-2023-3-19-26.
4. Алсаид Мазен, Саламех Али. Способ изготовления образцов из многослойных композиционных материалов для изучения их механических свойств // Вестн. Астрахан. гос. техн. ун-та. Сер.: Морская техника и технология. 2018. № 4. С. 16–23. DOI:https://doi.org/10.24143/2073-1574-2018-4-16-23.
5. Саламех Али, Алсаид Мазен. Исследование влияния типа связывающего компонента на механические характеристики полимерных композиционных материалов // Мор. интеллектуал. технологии. 2022. Т. 1. № 1. С. 52–62.
6. Алсаид М., Саламех А., Мамонтов В. А. Исследование прочности судостроительного полимерного композиционного материала // Вестн. Гос. ун-та мор. и реч. флота им. адм. С. О. Макарова. 2019. Т. 11. № 3. С. 543–553. DOI:https://doi.org/10.21821/2309-5180-2019-11-3-543-553.
7. ГОСТ 4648-2014. Пластмассы. Метод испытания на статистический изгиб. М.: Стандартинформ, 2014. 34 с.
8. ГОСТ 11262-2017. Пластмассы. Метод испытания на растяжение. М.: Стандартинформ, 2017. 24 с.
9. ГОСТ 4651-2014. Пластмассы. Метод испытания на сжатие. М.: Стандартинформ, 2014. 19 с.

