


Россия
Россия
Россия
Россия
Россия
Россия
Россия
Маломерный флот является неотъемлемой частью промыслового флота Российской Федерации, он занимается выловом гидробионтов, обитающих в прибрежной зоне, а также в озерах и водохранилищах, где можно проводить операцию по ловле траловой конструкцией. На данный момент существует проблема с выбором орудия лова, т. к. при проектировании сложно определить точную и близкую к реальной тягу судна. При расчете тяги используют методы, подходящие для средних и крупнотоннажных судов, поэтому результаты для маломерного флота получаются лишь оценочными. Самый проверенный метод определения тяги – опытным путем, но такой метод непродуктивен с финансовой точки зрения, поэтому более простой вариант проведения аналогичных испытаний – с созданной уменьшенной версией оригинального рыболовного судна, а также использование компьютерных технологий для определения необходимых данных. Проведение опытов с моделью рыболовного судна является более экономичным решением, но требует высоких познаний в моделировании тяговых характеристик судна. Опытным путем были проведены исследования тяги моделей: катера Syma Q1 Speedboat RTR 2.4G SYMA-Q1 и катамарана, который состоит из двух таких катеров. Данные работы учитывают взаимосвязь «судно – орудие лова» и определяют тяговые характеристики, к которым относятся непосредственно сила тяги рыболовного судна и различные сопротивления его элементов (корпус, гребной винт и пр.), которые влияют на конечное значение тяги. При траловом лове возникает гидродинамическое сопротивление элементов траловой конструкции, которое необходимо уметь сопоставлять с тягой рыболовного судна. По полученным экспериментальным данным были построены зависимости для судов; также при использовании разработанной компьютерной программы для ЭВМ «Гидродинамика судна» появляется возможность вы-полнить расчет и анализ давления воды на объект, а также определить, на какие участки оказывается большее давление.
катамаран, эксперимент, бассейн, тяга, катер, сопротивление, плавучий якорь, 3D-мо- делирование
Introduction
The small-sized vessels are an integral part of the country's fishing fleet, as they provide a significant proportion of the food supply through the catch of coastal hydrobionts. In addition, such vessels are actively used in lakes and reservoirs.
Small commercial vessels are small vessels used for fishing and other commercial purposes.
Fig. 1 shows a prospective design of the MRTR-30 fishing vessel intended for catching and cooling of catch in coastal waters.

Fig. 1. Perspective design of the MRTR-30 fishing vessel for fishing in coastal waters
The thrust developed by the engines of small commercial fishing vessels depends on their type and power. Typically, these vessels are equipped with diesel or gasoline engines that provide sufficient power to propel the vessel and perform various operations such as towing fishing gear, hauling catch, etc.
Calculation of propulsion of a small vessel is an important stage in the design and operation of such vessels. Various methods including empirical formulas and theoretical models are used to calculate propulsion.
Main stages of propulsion calculation:
– determination of: displacement; ship speed; shape resistance coefficient; water density;
– water resistance calculation;
– propeller selection;
– engine power estimation;
– stability and controllability check.
At the moment, when calculating the draught, methods suitable for medium-sized, large-capacity vessels are used, and the results for small-sized fleet are only estimated.
For the development of coastal fishery it is necessary to be able to determine the draught characteristics of the fishing vessel. These characteristics first of all include thrust force. The rest are various resistances of the vessel structure (hull, propeller, etc.), which affect the final value of thrust [1-4].
As trawl fishing is the main type of industrial production of hydrobionts, it is necessary to carry out studies of hydrodynamic resistance of trawl structures. The obtained experimental data and dependencies allow comparing the aggregate resistances with the draught of the fishing vessel. The small-sized fleet should have such technical characteristics that there are no problems with lack of thrust under fishing conditions.
For a more accurate determination of thrust, an experimental method is used, but it is very expensive. Therefore, the authors of the paper propose a simpler option of conducting similar tests with the created model of a fishing vessel and using computer technologies. This approach allows to significantly reduce the cost of experiments and improve the accuracy of calculations. It is the financial component that plays a key role in the process of any research. If there is an opportunity to scientifically justify certain processes with the least expenses of money and time, then, of course, this approach is rational. But at the same time, the error rate of such research should be low.
Purpose and objectives
In order to obtain data on the study of fishing vessel thrust and comparison of hydrodynamic resistance of the trawl on the basis of FSBEI HE “Kaliningrad State Technical University” in the wholesale basin were conducted experiments with the model of the boat Syma Q1 Speedboat RTR 2.4G SYMA-Q1 and the model of a catamaran consisting of similar boats (Fig. 2).

a

b
Fig. 2. Experimental models of a boat (a) and a catamaran (b)
Table 1 includes the characteristics of these models, the table includes the main parameters determining the operation of the electric motor of the boat and catamaran at nominal values of voltage U = 7.2 V and current I = 6 A.
Table 1
Specifications of the models of the boat and catamaran under test
|
Models |
Length L, m |
Width H, m |
Number of propeller blades |
Diameter of the propeller D, m |
Rated power |
Motor |
Rotational |
|
|
electric motor Nm = UI, W |
on the shaft Ns, W |
|||||||
|
Boat |
0.373 |
0.117 |
2 |
0.034 |
43.2 |
23.42 |
54.2 |
480 |
|
Catamaran |
0.350 |
2 |
0.034 |
|||||
|
3 |
0.028 |
|||||||
To take into account the vessel-fishing gear relationship, homemade floating anchors (FA) were attached to the models. They simulated trawl fishing, which, in turn, created additional load caused by aggregate resistance. The characteristics of the FA are listed in Table 2.
Table 2
Characteristics of floating anchors used during the experiments
|
Floating anchor |
Diameter Df.a, m |
Length Lf.a, m |
Material |
|
FA-1 |
0.085 |
0.090 |
Polyethylene terephthalate |
|
FA-2 |
0.10 |
0.11 |
|
|
FA-3 |
0.13 |
0.14 |
|
|
FA-4 |
0.17 |
0.18 |
|
|
FA-5 |
0.285 |
0.265 |
It should be emphasized that experimental studies should be conducted with a small version of the original fishing vessel. In case the tests are conducted with a physical model, the natural dimensions of which do not exist, the obtained dependencies cannot be correlated with any fishing vessel without significant errors. Such errors can completely distort the actual value of the thrust force. Such experiments may be of an evaluative nature or may be used to design a new fishing unit to obtain optimum performance for fishing.
Material and methodology
The experiments were carried out in three stages:
– models of a boat and a catamaran were tied to moorings (Fig. 3) and their pull was determined using a load cell;
– а tensor was used to measure the resistance of the FA (floating anchors) (Fig. 4) by setting specific cart speeds for towing through a control panel located at the end of the room next to the wavemaker;
– by means of a stopwatch and a tape measure, the speeds of the tested models were calculated when towing the FA (Fig. 5).
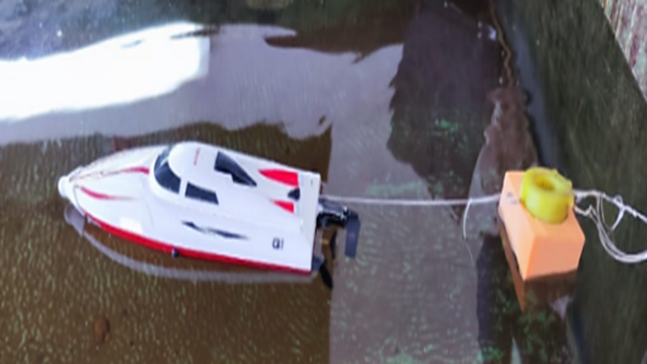
Fig. 3. Determination of the force of thrust on the moorings of the boat model under test
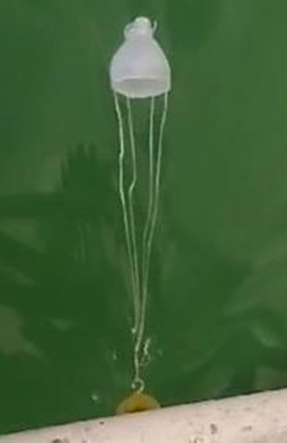
Fig. 4. Floating anchor No. 2 with 5 kg load cell connected

Fig. 5. Experiments with a catamaran model to determine velocities with different floating anchors
Execution of the first stage allows to obtain the thrust of the ship model at a speed equal to zero. This is due to the fact that the ship does not travel any distance during mooring and therefore has no speed. This thrust value is as close as possible to the available thrust PP at zero speed. It should be set as a boundary value of the available thrust when plotting the graphs discussed below.
At the next stage, we obtain the values of hydrodynamic resistance of all floating anchors with a speed range of 0.5-2 m/s. Using different sizes of FA allows obtaining different values of hydrodynamic drag, which affects the final value of thrust (disposable thrust) of the boat and catamaran models. Such experiments are required to obtain multiple plots of the dependence of hydrodynamic drag of FA on their towing speed. The graph of the dependence of the disposable thrust on speed is superimposed on them, which we obtain thanks to the final stage.
The last stage is performed as follows. We lower the ship model on the water. Securely fix a measuring tape (we used a geodetic tape measure) from the beginning of the test model to the end of the pool. Two homemade buoys from bottles with a weight on the end of the rope mark certain distances on the water, but in such a way that the model does not touch them during the stroke. Connect the FA, which should also not touch the buoys during movement. Immerse the floating anchor in the water, but do not release its pull so that the anchor is not under the model and does not touch the propeller. At the same time, let go of the luff, turn the model on to maximum power and start the stopwatch. Use the stopwatch to measure the distances marked by the buoys. Knowing the path and time, we find the speed of the test model with the towed floating anchor. Do the same experiments with each FA.
It should be understood that the ship model produces non-uniform rectilinear motion. From the beginning of the motion to the stop there is a change of speed, i.e. acceleration. It is necessary to take this into account and find the average speed in the section where the ship is moving uniformly. For this purpose, the software Sensor Logger was used, which was installed on a phone. The phone itself was fixed on the test model (Fig. 6, 7).

Fig. 6. Program Sensor Logger for measuring the acceleration of the catamaran

Fig. 7. Interface of the Sensor Logger program
Thus, the following values were obtained:
– mooring thrust for the tested models;
– resistances of FA with speeds of 0.5, 1.0, 1.5, 2.0 m/s;
– average speeds of the model boat and catamaran with different FA.
Experimental data on determining the pulling force on the moorings of the boat and catamaran models using different propellers are given in Table 3.
Table 3
Experimental data on mooring thrust force
|
Model |
Diameter of propeller D, m |
Pulling force on the moorings Pp, N |
|
Catamaran model |
0.034 |
12.0 |
|
0.028 |
10.0 |
|
|
Boat model |
0.034 |
6.0 |
Table 4 shows the experimental data for determining the hydrodynamic resistance of FA.
Table 4
Experimental data on resistance of floating anchors
|
Floating anchors |
Setpoint speed of the cart v, m/s |
|||
|
0.5 |
1.0 |
1.5 |
2.0 |
|
|
Aggregate resistance Rx, N |
||||
|
FA-1 |
1.3 |
4.1 |
8.7 |
15.9 |
|
FA-2 |
1.8 |
6.6 |
13.2 |
22.5 |
|
FA-3 |
3.1 |
12.3 |
24.1 |
41.9 |
|
FA-4 |
4.3 |
14.7 |
32.0 |
– |
Experimental data on the velocities of the tested models with different FA are presented in Table 5.
Table 5
Velocities of model boat and catamaran with different floating anchors
|
Floating anchors |
Speed of the catamaran model v, m/s |
Speed of the model boat v, m/s |
|
|
Diameter of propeller |
|||
|
D = 0,028 m |
D = 0,034 m |
||
|
FA-1 |
0.77 |
1.00 |
0.95 |
|
FA-2 |
0.71 |
0.90 |
0.84 |
|
FA-3 |
0.61 |
0.75 |
0.68 |
|
FA-4 |
0.55 |
0.67 |
0.59 |
|
FA-5 |
0.38 |
0.45 |
– |
According to the experimental data in Table 4, the approximating functions were carried out and the aggregate resistance coefficients of FA, having the dimension of kg/m3, were determined:
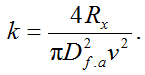
The values of k are recorded in Table 6.
Table 6
Approximation error δ and coefficient k for four tested floating anchors
|
Floating anchors |
Maximum approximation error δ, % |
Resistance coefficient of FA k, kg/m3 |
|
FA-1 |
14 |
780 |
|
FA-2 |
12 |
800 |
|
FA-3 |
10 |
720 |
|
FA-4 |
9 |
685 |
By means of computer programs and collected experimental data, graphs of dependencies are plotted and scales are modeled for natural dimensions of the fishing vessel and gear. Scale modeling is performed according to multiphysics similarity, where power scale CR is used to obtain natural values of available thrust and aggregate resistance of the trawl system.
On the basis of Tables 3-6 we plot the curve of available thrust of the boat model Pp = f(v) and the curves of aggregate resistance of FA Rx = f(v) (Fig. 8, 9).

Fig. 8. Aggregate resistance curves of FA Rx = f(v)
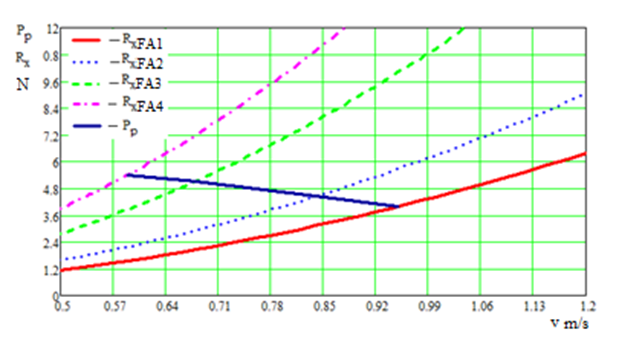
Fig. 9. Curves of aggregate drag of FA Rx = f (v) and available thrust of the tested boat model Pp = f(v)
Based on the graph in Fig. 9, we can see that the pull of the tested model is capable of towing trawl models up to 6 N. It is worth noting that such tests were previously conducted with the N-MWT-m2 1.65/6.0 m multi-depth trawl model and a towing speed of 0.15 m/s was obtained [5].
Using the same principle, we plot the dependence graphs for the catamaran model (Fig. 10).

Fig. 10. Graph of the resistance of FA Rx = f (v) and disposable thrust graphs Pp = f (v), Pp1 = f (v)
Since the experiments were conducted using two types of propellers, the available thrust is different: Pp – propeller with D = 34 mm and Pp1 – at D = 28 mm.
Since two types of propellers were used, the available thrust is different: Pp – when using a propeller D = 34 mm and Pp1 – when D = 28 mm.
From Fig. 10, we obtain that the model of the tested catamaran can produce trawl model thrust up to 7.2 and 9.6 N, respectively.
Correlation of the available draught and resistance of floating anchors to the speed of movement on the graphs helps to further determine the permissible and optimal values of resistance, depending on the size of the trawl, for a natural fishing vessel. Trawl dimensions are selected depending on the fishing quota, on the speed of movement of schools of fish being caught, on the operating conditions and other factors.
Modern computer programs, such as “Ship Hydrodynamics”, allow virtual tests of vessels in various conditions [6]. This program uses the finite element method (FEM), to simulate fluid flows around the hull of the vessel and calculate the forces acting on it.
The advantages of computer modeling are: time and cost savings; high accuracy and safety.
Thus, the use of computer technologies to calculate the thrust of small vessels is an effective and cost-effective way to improve the accuracy of design work and optimize designs.
For the program operation a three-dimensional model of the vessel was created using the program Blender (Fig. 2). The model accurately reflects the geometric features of the hull, including outlines, bottom shape and other important details.
Then the model is divided into small elements (cells) forming a grid, which is used for numerical solution of hydrodynamics equations:
– a modified continuity equation:

where p – pressure exerted by the aqueous medium; t – study time; ρ – water density; v – flow velocity vector relative to the hull of the ship model; α – coefficient of artificial compressibility of the medium;
– equations of conservation of momentum:
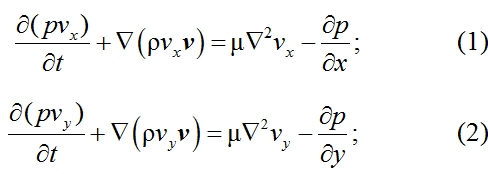
where vx, vy, vz – the components of the velocity vector v along the x, y, z directions, respectively; μ – the dynamic viscosity of water.
The given Navier-Stokes equations describe the motion of a viscous incompressible fluid. Their solution with the help of the program allows to determine the distribution of velocities and pressures in the flow. By visualizing the tested models and floating anchors on the monitor screen, taking into account the pressures exerted during the tests, it becomes clear at which sections the pressure has the highest value.
After the method of coordinate splitting on equations (1)-(3) we obtain a system of equations for velocity and pressure projections at each point of the computational grid and along each direction.
After transforming the system of equations into linear equations with separation of nonlinear coefficients, we obtain a tridiagonal system of linear algebraic equations of the form
 ,
,
where ai, bi, ci – are the coefficients of the tridiagonal matrix; xi – are the unknowns; di – is the right-hand side of the system of equations, for the solution of which the method of running is used
The algorithm of the method involves two steps.
Direct run – using recurrence relations, the run parameters βi and γi are determined:

when i = 2, 3, …, n – 1 and initial β1 = c1 / b1; γ1 = d1 / b1, where n – is the number of equations and unknowns.
Backward pass – using the recurrence relation the unknowns are determined xi:
 ,
,
when i = n – 1, n – 2, …, 1 and initial xn = γn.
Having calculated the values of βi and γi on the forward pass, we find all xi on the reverse pass.
The obtained data are processed and visualized. It is possible to see the zones of increased pressure and stress.
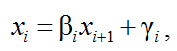
The results of calculations in the computer program “Ship Hydrodynamics” on the surface of the boat and the results of indices of pressure fields on the surface of each floating anchor are presented in Fig. 11, 12 respectively.
These figures carry information about the effect of water pressure on an object immersed in water, and also show in which areas the pressure exerts a greater force.
Fig. 11. Computer modeling of boat Syma Q1 Speedboat RTR 2.4G SYMA-Q1

Fig. 12. Computer modeling of floating anchor: FA-1 (a); FA-2 (b); FA-3 (c); FA-4 (d); FA-5 (e)
The scientific significance of the conducted research lies in the development and substantiation of the methodology of verification and validation of the results of numerical experiments, based on comparison with the data obtained experimentally on natural objects (boat and catamaran) and their physical models.
Conclusion
According to the conducted physical and mathematical experiments on studying the hydrodynamics of the tested ship models, the following results were obtained:
It was found that even such a small vessel shows quite approximate results. That makes it possible to conduct similar tests with other models of vessels changing engines, propellers, floating anchors. Compared to other methods, this method is less costly both in time and financial terms.
Numerical experiments with the created three-dimensional models of a boat and a catamaran with their exact sizes and shapes, using a special program that visually shows the impact of water on the shape of the object, under a given mode of operation.
1. Недоступ А. А. Физическое моделирование гидродинамических процессов движения орудий рыболовства // Вестн. Томск. гос. ун-та. Математика и механика. 2012. № 3 (19). С. 55–67.
2. Недоступ А. А., Ражев А. О. Создание правил мультифизического подобия тралового комплекса // Морские интеллектуальные технологии. 2021. № 1. Т. 1. С. 132–137.
3. Недоступ А. А., Наумов В. А., Ражев А. О., Дятченко С. В. Уравнения электродинамического подобия траловых лебедок с электрическим приводом // Морские интеллектуальные технологии. 2020. № 4. Т. 1. С. 87–91.
4. Ражев А. О., Недоступ А. А., Львова Е. Е. Математическая модель визуализации крученых канатно-веревочных изделий для задач проектирования орудий промышленного рыболовства // Природные ресурсы, их современное состояние, охрана, промысловое и техническое использование: материалы XI Национ. (всерос.) науч.-практ. конф. Петропавловск-Камчатский: Изд-во КамчатГТУ, 2020. С. 222–226.
5. Недоступ А. А., Ражев А. О., Насенков П. В., Львова Е. Е., Сысенко В. В., Аскаров Д. В. Экспериментальные исследования геометрических и силовых характеристик моделей разноглубинного трала в гидроканале «Фишеринг Сервис // Морские интеллектуальные технологии. 2022. № 3. Ч. 1. С. 16–21.
6. Недоступ А. А., Ражев А. О. Математическое моделирование орудий и процессов рыболовства. Ч. II: моногр. Калининград: Изд-во КГТУ, 2014. 249 с.
