


Russian Federation
On chemical tankers, the main cargo devices are pumps, so it is necessary to constantly monitor their operating conditions and performance indicators during operation. The article discusses modeling using MATLAB/Simulink software of a single-stage horizontal centrifugal pump, which can be used to create an information-measuring system for monitoring the performance of cargo pumps using the example of a chemical tanker of the Ivan Poddubny type. An analysis of the modeling results is carried out, including an assessment of pump efficiency, pressure loss and other indicators in various operating modes. The results allow us to draw conclusions about the operation of the pump under various loads and variable conditions. The simulated pump worked with seven different liquids pumped in chemical tankers: ethyl alcohol, N-propyl alcohol, phenol, chloroform, castor oil, 55% nitric acid and water. After this, a neural network was created using the MATLAB/Neural Network Fitting Tool application. The input data of the network were volumetric flow, pressure, shaft power, torque and suction pressure. The output value was the pump efficiency, the value of which was estimated for each fluid. The root mean square error of approximation was very close to zero. According to these results, the artificial neural network showed satisfactory results for predicting the efficiency of the centrifugal cargo pump of the Ivan Poddubny type chemical tanker; therefore, it can be used in ship information and measurement systems. Overall, this paper represents a valuable research contribution to the field of modeling horizontal centrifugal pumps using Simulink that can be useful to engineers and researchers involved in the design and optimization of these pumps.
chemical tanker, centrifugal pump, model, MATLAB, performance
Introduction
The cost of a cargo pumping system on a ship is 8% of its total cost. According to [1], cargo pumps use 20% of a ship's electrical energy consumption during cargo operations, which puts them in first place. In addition, improving the design and choosing the right pump according to the operating conditions can save 30% of energy consumption [1]. On ships, many auxiliary systems have pumping equipment and their energy consumption is noticeably higher compared to other equipment. Centrifugal pumps are commonly used both onshore and on ships. For this reason, the issue of the efficiency of centrifugal pumps on ships is becoming increasingly relevant.
Chemical tankers are expected to spend less time in port, which is why port authorities and shipowners are demanding increased transhipment speeds. In addition, during a cargo unloading operation, the safety of the environment and the crew is an important issue. Therefore, reliable material transfer pumps play an important role in meeting these requirements.
The purpose of the study is to develop a model used in the information and measurement system of the tanker cargo system, capable of predicting, optimizing and improving pump efficiency to improve system performance.
Materials and methods of research
Modeling and using an artificial neural network (ANN) to predict the performance of cargo pumps on a chemical tanker is a new and applicable approach for an operating pump. Using these methods, chemical tanker cargo handling operations can be optimized. They can be useful for monitoring the condition of the cargo pump, and as a result, losses in its efficiency can be detected. Several lines of research have focused on achieving these goals. These studies used both design and operating parameters of centrifugal pumps to improve or evaluate efficiency using various algorithms and methods [2-5]. As a result of a literature review [6-9] on the optimization of centrifugal pumps, the main topic of research can be classified as optimization of the design of the volute, diffuser blades and impeller, load optimization of parallel pumps, diagnostics and evaluation of performance or malfunctions. Research has primarily focused on centrifugal pumps in onshore plants or systems, and no studies have been conducted to evaluate the performance of centrifugal pumps when handling various chemicals in shipboard environments with constant changes in pump parameters. The application of artificial intelligence to a ship at the operational level is a new approach that can be useful for monitoring the condition and assessing the performance of equipment in the ship's engine room.
In this study, the efficiency prediction of a centrifugal pump was performed using ANN. The data for the selected pump was taken from the technical documentation on the Ivan Poddubny type vessel and can be used for loading and unloading operations in chemical tankers. The use of ANN to predict the performance of cargo pumps on chemical tankers is a new approach to the cargo pump. It is possible to monitor the condition of the cargo pump, detect and correct efficiency losses. At the first stage of the study, a single-stage horizontal centrifugal pump was modeled with its total pressure (H) – volume flow (Q), pump efficiency (η) – Q, shaft power (P) – Q, required net hydraulic head (cavitation reserve) (NPSHr) – Q using MATLAB/Simulink software. The simulated pump was then operated with seven different liquids, such as water, ethyl alcohol, propanol, phenol, chloroform, castor oil and 55% nitric acid. Thus, performance curves and data sets for each condition were obtained numerically. The ANN was created using the MATLAB/Neural Network Fitting Tool application, and the network was trained on the resulting data sets. In this study, performance for each condition was assessed with an acceptable error rate across some trials.
MATLAB Simulink application is used to simulate a centrifugal pump. Simulink is a flowcharting environment for multi-domain modeling and model-based design. It supports simulation, automatic code generation, and continuous testing and verification of embedded systems. Simulink provides a graphical editor, custom block libraries, and solvers for modeling dynamic systems (Mathworks 2018). Performance diagrams, operational information on pipeline lengths and design parameters were provided from the design documentation for the Ivan Poddubny type vessel. Total head (H), specific rotation speeds (nq), torque, pump efficiency and NPSHr equations were coded into the model using the obtained data. Pump efficiency can be calculated using the formula:
η = ρg / 1 000N.
Total head can be described as the ability of a pump to lift fluid to a certain height or the ability to develop a given discharge pressure. It can be found using the sum of static head (Hs), suction hydraulic losses (Hp), discharge hydraulic losses (Hv) and free head (HL). These components can be obtained using the following equations [6]:
H = Hs + Hp + Hy + HL;
Hs = zd – zs;
Hp = (ρd – ρs) / gρ;
Hv = (v2d – v2s) / 2g;
HL = hf – hm.
Equation forms the NPSHr formula:
NPSHr = Patm + Pg + Hv + Hvp.
In these equations, Patm represents the atmospheric pressure, and Pg denotes the gauge pressure, the discharge height is zd, and zs is the suction side height, Hvp is the saturated vapor pressure of the liquid, P is the discharge pressure pd, the suction pressure ps, the fluid flow rate on the discharge side is vd, and the speed on the suction side is vs. To determine HL, it is necessary to find losses in the pipeline (hf), as well as losses in fittings and elbows (hm). For pipe losses, the Darcy-Weisbach formula was used because it provides the most accurate results for various applications [7]. The coefficient of friction (f) is calculated using the Colebrook equation, and the relative roughness is obtained from tables depending on the pipe material. Losses of valves, fittings and bends were calculated using tables, and their angles, materials and the number of connecting elements in the circuit were specified on the ship using pipeline diagrams. The selected pump pumps various liquids, and these liquids are also pumped in chemical tankers. In the model, the volumetric flow rate was increased linearly from 0 to 30 m3/h by adding 0.1 m3/h at each stage. Power has also been increased linearly from 5.5 to 9 kW, and its increments depend on flow. The performance and size of the pump are also similar to the cargo pump of the Ivan Poddubny type tanker. After generating the Simulink model, seven different fluids were selected according to their density and viscosity. Water is the reference fluid for the pump model. The model tested chemicals with different viscosities and densities to observe the effect of liquid density and viscosity on pump performance. Table 1 illustrates the properties of chemicals selected from the International Code for the Construction and Equipment of Ships carrying Dangerous Chemicals in Bulk (IBC Code).
Table 1
Properties of chemicals used in the model
|
Liquid |
Density, kg/m3 |
Kinematic viscosity, cSt |
Hvp, Pa |
|
Ethyl alcohol |
772 |
1.51 |
9 000 |
|
Propanol |
804 |
2.8 |
2 400 |
|
Phenol |
1 078 |
11.3 |
500 |
|
Chloroform |
1 489 |
0.38 |
30.000 |
|
Castor oil |
960 |
1 017 |
0 |
|
Water |
997 |
1.003 |
2 330 |
|
Nitric acid (less than 70%) |
1 339 |
5 |
7 700 |
Viscosity and density values were selected from tables when taking liquids at 20 °C. The pump model was then run with the test fluids, resulting in plots of flow versus power, head, required net positive suction head, efficiency, and torque. In addition, the datasets obtained numerically from the model were prepared for ANN application. The pump model is shown in Fig. 1.
One of the artificial intelligence algorithms (ANN) has a wide range of applications in accordance with these goals. The network can be trained and can improve or estimate future conditions using various data. To achieve successful performance evaluation, the MATLAB Neural Network Fitting Tool is used to create the ANN. The most important components of an ANN are the number of layers and neurons. To detect a sufficient number of layers, neurons, and the splitting factor of the training test, various tests must be performed.
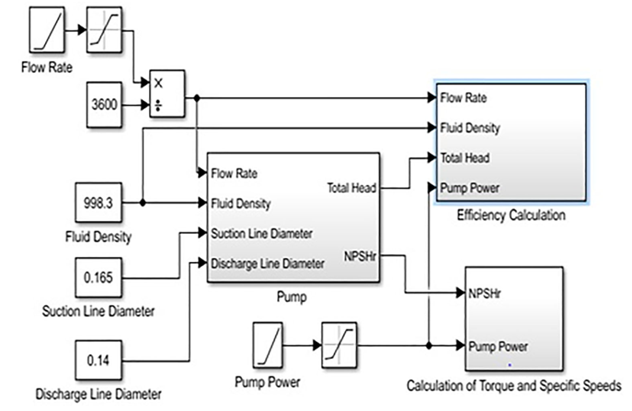
Fig. 1. A model of a centrifugal pump in a SIMULINK environment
Table 2 illustrates the network information. A number of layers ranging from 1 to 5 were tried. Using one hidden layer and one output layer provided optimal results in this model. In addition, numbers of neurons ranging from 1 to 20 were tried, and 10 neurons were decided to be suitable for testing. The Levenberg-Marcourdt, Bayesian regularization, and scaled conjugate gradient algorithms were tested as a training function. The model with the Levenberg-Marcourdt algorithm had better performance for optimizing ANN parameters (bias and weight). The algorithm has wider application in similar studies. The percentages for training, validating and testing the network were determined by testing different options to avoid overfitting. After testing, it was decided to use 70% training, 15% checking and 15% testing. The network has network inputs Q, H, NPSHr, Pm and M. The parameters were selected using the mathematical relationships of the model and studying similar studies. The result is efficiency, so the network can evaluate the performance of the model. Supervised learning was carried out using a neural network with feedforward feedback. This way the output will be informed by the input layer. Input variables are then passed through these layers. The transfer process was carried out by transferring functions. After this, the variables participate in the hidden layers through the connection of neurons in the input and hidden layers. Due to the weight of neurons, fundamental estimates are hidden in the ANN. The neurons in the hidden layer weigh the sum of the outputs of the previous layers. The bias then measures the previous information and the sum of the results passed through the transfer function. The hyperbolic tangent sigmoid function was defined as the activation function.
Table 2
Technical characteristics of the ANN model
|
Characteristic |
Content / Value |
|
Neural network type |
Feed-forward backpropagation |
|
Training function |
Levenberg-Marqurdt |
|
Learning function |
Gradient descent with momentum weight and bias learning function (Leamgdm) |
|
Performance measurement function |
MSE fl-squared |
|
Number of layers |
1-5 |
|
Number of neurons |
1-20 |
|
Training-validation-test split |
90-5-5 80-10-10 70-15-15 60-20-20 |
|
Transfer (activation) function |
Hyperbolic tangent sigmoid transfer function (Tansig), Linear transfer function (Purelin) |
The neural network fitting tool uses the last two functions as activation and output functions. Researchers have proposed performance functions to measure the accuracy and determine the error rate of a model. In this study, the performance function was defined as “mean square error (MSE)” in the tool. A lower MSE value means less error. The correlation coefficient (R) and its square were used to determine the strength of the predictions. If the square of the correlation coefficient is close to 1, the relationship is stronger. Figure 2 illustrates the architecture of the selected ANN for performance evaluation [8].
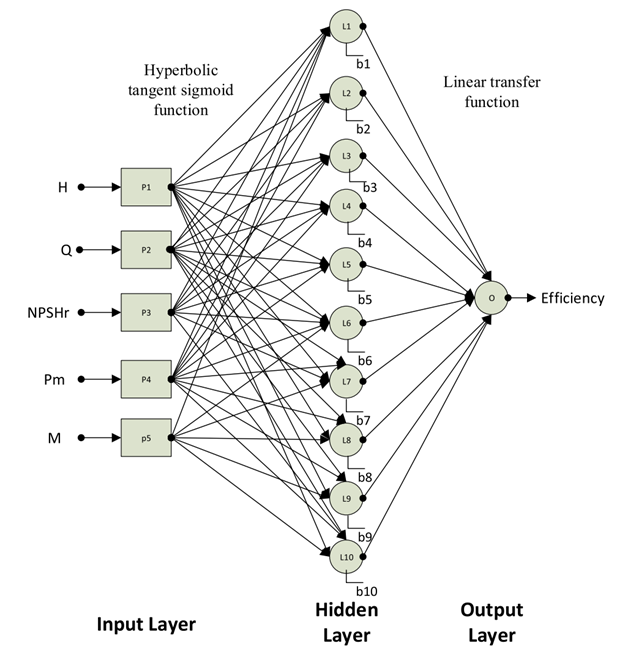
Fig. 2. Architecture of the selected ANN when assessing performance
Research results and discussion
When the pump was operated with the liquids indicated in Table 1, H, NPSHr and η were obtained from the model at the optimal flow rate (15 m3/h). Table 3 illustrates the results.
Table 3
Model output data at optimal flow rate
|
Liquid |
H, m water column |
NPSHr, m water column |
η |
|
Ethanol |
93.786 |
1.444 |
0.423 |
|
Propanol |
89.933 |
0.895 |
0.422 |
|
Phenol |
66 305 |
2.697 |
0.423 |
|
Chloroform |
47.167 |
6.370 |
0.409 |
|
Castor oil |
74 327 |
1.907 |
0.419 |
|
Water |
70.045 |
2.701 |
0.394 |
|
Nitric acid (less than 70%) |
50.99 |
5.12 |
0.380 |
The pressure is inversely proportional to the density of the liquid. It can be seen that the efficiency increases, and the density of the liquid decreases. The kinematic viscosity and vapor pressure of the fluid also affect the overall efficiency of the pump. Castor oil is the most viscous liquid among others and its vapor pressure is 0. Its density is close to the reference liquid (water).
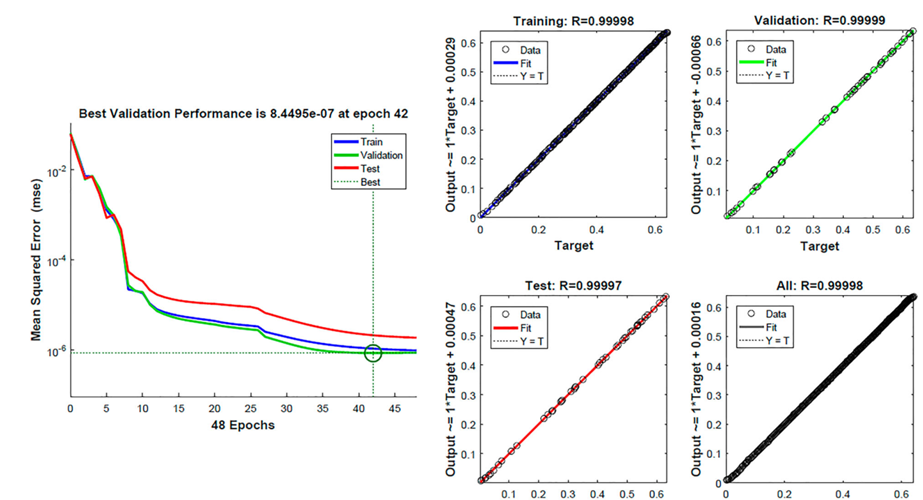
An analogy between chloroform and nitric acid showed that higher vapor pressure leads to a drop in head. In addition, the required net positive suction head was higher when the vapor pressure and liquid density were higher. This leads to a difference between the resulting net NPSH and the required net NPSH, in other words, cavitation. With a significant increase in liquid density compared to the reference value, a significant decrease in pump pressure is observed. As a result of working with different fluids, seven different data sets were obtained. These data sets were normalized with minimum and maximum normalization and organized to evaluate the performance for different liquids using neural networks. Figure 3 shows test and regression performance graphs for the water data set. An R value of 0.99998 was obtained and R2 provided a prediction accuracy of 99.996%.
a b
Fig. 3. ANN results with a water data set: test effectiveness (a); regression analysis graphs (b)
Table 4 shows the input data, output estimates, and errors for water. The water treatment model was very close to 0 (1.1817e-6). When the ANN model was built using ethyl alcohol, the root mean square error was very close to 0 (8.35e-5).
Table 4
Input data, output estimates and errors for water
|
Q, m3/h |
H, m |
NPSHr, m |
Pm, kW |
Torque, Nm |
Performance, O.E. |
Projected performance, O.E. |
Error |
|
0 |
69.86 |
2.7028 |
5.5000 |
17.8942 |
0.0000 |
0.008533 |
–0.00853 |
|
2 |
69.87 |
2.7028 |
5.7330 |
18.6523 |
0.0663 |
0.066339 |
–3.1e-05 |
|
4 |
69.88 |
2.7027 |
5.9660 |
19.4103 |
0.1275 |
0.127272 |
0.000183 |
|
6 |
69.89 |
2.7026 |
6.1990 |
20.1684 |
0.1840 |
0.183911 |
0.000127 |
|
8 |
69.91 |
2.7024 |
6.4320 |
20.9265 |
0.2366 |
0.237066 |
–0.0005 |
|
10 |
69.94 |
2.7022 |
6.6650 |
21.6845 |
0.2855 |
0.285636 |
–0.00014 |
|
12 |
69.98 |
2.7019 |
6.8980 |
22.4426 |
0.3312 |
0.330769 |
0.000415 |
|
14 |
70.02 |
2.7016 |
7.1310 |
23.2007 |
0.3740 |
0.37363 |
0.000347 |
|
16 |
70.07 |
2.7012 |
7.3640 |
23.9587 |
0.4142 |
0.414418 |
–0.00026 |
|
18 |
70.12 |
2.7008 |
7.5970 |
24.7168 |
0.4520 |
0.45246 |
–0.00047 |
|
20 |
70.18 |
2.7004 |
7.8300 |
25.4748 |
0.4877 |
0.52101 |
0.000436 |
|
22 |
70.25 |
2.6998 |
8.0630 |
26.2329 |
0.5214 |
0.554075 |
–0.00063 |
|
24 |
70.32 |
2.6993 |
8.2960 |
26.9910 |
0.5534 |
0.583232 |
0.000615 |
|
26 |
70.40 |
2.6987 |
8.5290 |
27.7490 |
0.5838 |
0.61401 |
–0.00123 |
|
28 |
70.48 |
2.6980 |
8.7620 |
28.5071 |
0.6128 |
0.635046 |
0.005336 |
|
30 |
70.58 |
2.6973 |
8.9950 |
29.2652 |
0.6404 |
0.008533 |
–0.00853 |
Conclusions
The results of the Simulink model showed that when the pump pumps a fluid with a lower density than the reference fluid, the pump's head and efficiency increase. The NPSHr value increased with increasing density. When the pump was operated with viscous fluids, NPSHr decreased and pump head increased compared to less viscous fluids with similar densities.
The use of ANN has shown that performance assessment can be achieved using an information and measurement system for monitoring operating data. This data is recorded on the ship and can be made available to the shipping companies' technical departments. The terminals also track this data. The use of this type of information can be important during the construction of a chemical tanker. Forecasts with different liquids can enable safer and more efficient cargo operations. The results of the work showed that the network predicted a root mean square error close to zero (1.1817e-6). The performance estimates for six other data sets have satisfactory values.
1. Nikitenko Ia. A., Zhelezniak A. A. Metody povysheniia dostovernosti kontrolia dia-gnosticheskikh kharakteristik oborudovaniia. Aktual'nye aspekty i prioritetnye napravleniia razvitiia transportnoi otrasli [Methods of increasing the reliability of monitoring diagnostic characteristics of equipment. Current aspects and priority directions of development of the transport industry]. Materialy Molodezhnogo nauchnogo foruma studentov i aspirantov transportnykh vuzov s mezhdunarodnym uchastiem (Sankt-Peterburg, 14-15 noiabria 2019 g.). Moscow, Pero Publ., 2019. Pp. 210-214.
2. Zaritskii S. P. Diagnosticheskoe obsluzhivanie oborudovaniia KS: obzornaia informatsiia. Seriia: Gazovaia promyshlennost' na rubezhe XXI veka [Diagnostic mainte-nance of CS equipment: overview information. Series: Gas industry at the turn of the XXI century]. Moscow, IRTs Gazprom, 2000. 156 p.
3. Burkov A. F., Mikhanoshin V. V., Nguen V. Kh. Povyshenie effektivnosti upravleniia kombinirovannymi energeticheskimi ustanovkami sudov [Improving the management efficiency of combined power plants of ships]. Vestnik Gosudarstvennogo universiteta morskogo i rechnogo flota imeni admirala S. O. Makarova, 2020, vol. 12, no. 2, pp. 381-389. DOI:https://doi.org/10.21821/2309-5180-2020-12-2-381-389.
4. Shatrovskii D. A. Perspektivnye energeticheskie ustanovki bol'shoi moshchnosti dlia morskikh sudov [Promising high-capacity power plants for marine vessels]. Sudostroenie, 2015, no. 5, pp. 33-35.
5. Bordiug A. S. Ideologiia formirovaniia tiporazmernykh riadov tsentrobezhnykh kompressorov sudovoi energeticheskoi ustanovki na baze avtomatizirovannogo proektirovaniia [The formation ideology of standard-sized rows of centrifugal compressors of a marine power plant based on computeraided design]. Vestnik Kerchenskogo gosudarstvennogo morskogo tekhnologicheskogo universiteta, 2021, no. 4, pp. 126-138.
6. Benini E., Cenzon M. Calibration of a meanline centrifugal pump model using evolutionary algorithms. Journal of Power and Energy, 2009, no. 223 (7), pp. 835-847.
7. Derakhshan S., Bashiri M. Investigation of an efficient shape optimization procedure for centrifugal pump impeller using eagle strategy algorithm and ANN (case study: slurry flow). Structural and Multidisciplinary Optimization, 2018, no. 58, pp. 459-473.
8. Coleman T., Branch M. A., Grace A. Optimization Toolbox for use with Matlab - User's Guide. The Matworks Inc., 1999. Available at: https://studylib.net/doc/18530413/optimization-toolbox-user-s-guide (accessed: 01.07.2023).
9. Isidori A. Nonlinear Control Systems. Springer-Verlag, London, UK, 1995. 549 p.
