Астрахань, Астраханская область, Россия
Россия
Рассматриваются применяемые материалы, состав и методы изготовления образцов из полимерных композиционных материалов (ПКМ). Приведена методика испытаний образцов из ПКМ на механические свойства. Для испытаний были изготовлены пластины, из которых были нарезаны образцы из ПКМ, на основе ровенговой стеклоткани, стекломата и полиэфирной смолы с добавлением отвердителя. С помощью механических испытаний определено влияние количественного соотношения слоев стекломата и ровинговой стеклоткани при испытании образцов на изгиб, растяжение и сжатие. Приведена схема структурного армирования пластин из ПКМ, проиллюстрированы графики зависимости средних значений разрушающих нагрузок и пределов прочности при испытании образцов на трехточечный изгиб, зависимости средних значений разрушающих нагрузок и пределов прочности при испытании образцов на растяжение, а также на сжатие. Проведен сравнительный анализ средних значений пределов прочности образцов при испытании на сжатие. В процессе анализа полученных данных после испытания образцов установлено, что с увеличением количественного соотношения слоев ровинговой стеклоткани в составе ПКМ увеличивается разрушающая нагрузка и предел прочности на растяжение, сжатие, но уменьшаются показатели значений прилагаемой нагрузки образцов из ПКМ при испытаниях на изгиб. Полученные экспериментальные данные результатов испытаний образцов из ПКМ являются основными показателями механических свойств ПКМ при различных схемах армирования их применения в судовых корпусных конструкциях, в частности как материал судовых цистерн.
судостроение, полимерные композиционные материалы, стекломат, ровинговая стеклоткань, полиэфирная смола, механические свойства, предел прочности, прилагаемая нагрузка, разрушающая нагрузка
Introduction
The development of modern technologies requires new design solutions. One of the most interesting and promising solutions is composite materials (CM). Polymer composite materials (PCM) have become increasingly used in modern industrial engineering; they are used when no other material meets the growing pace and requirements of future technologies. Application of PCM is one of the important priorities of the formation and development of new shipbuilding [1].
Currently, PCM are replacing traditional structural materials such as metal, aluminum alloys, wood and reinforced concrete. The possibilities of PCM are limitless due to the variety of both polymers and fillers, a variety of compounds and methods of their modification.
The unique properties of PCM are corrosion resistance under different climatic conditions, non-magnetism, high strength and low specific gravity
Different technologies are used for manufacturing PCM: contact molding, manual molding, closed vacuum molding, spraying, vacuum infusion, injection. Regardless of the technology used, the composition of PCM includes reinforcing and binding materials. As a reinforcing material in the manufacture of PCM, fibers from standard alkali-free aluminoborosilicate glass of the E brand or high-modulus magnesia-aluminosilicate glass of the VMP brand are mainly used [2].
The purpose of the study is to determine the influence of the location of reinforcing layers (glass wool and roving glass) on the values of tensile strength, compression and three-point bending. The object of the study is six layered samples of CM with the use of glass fabrics and with a different method of arrangement of reinforcing materials and a different quantitative ratio of layers.
Method of manufacturing PCM samples for testing mechanical properties
The new edition of the Russian maritime register of shipping (RMRS) rules states that PCM is allowed to be used in ship structures based on carbon, glass and aramid fibers as reinforcing elements, and epoxy, vinyl ether and polyester resins with the addition of a hardener are used as a binder.
In the process of manufacturing PCM samples, two schemes of laying CM were selected.
Two batches of plates (I and II) were made differently laying the glass fabrics. The composition of the PCM plates includes the following elements: EMC emulsion glass-600-1250- E, roving fabric EWR 560, polyester resin Yarkopol-110, and hardener methyl ethyl ketone peroxide (BUTANOX M-50).
The plates are manufactured by contact molding with manual laying on a matrix with dimensions of 1000×1000 mm, due to which the samples will turn out to be 600×600 mm in size.
The plates consist of six layers of reinforcing fiberglass, differ from each other only in the quantitative ratio of glass wool and roving fiberglass. The schematic diagram of the reinforcement of PCM plates is shown in Fig. 1. Table 1 shows the structural filling of PCM plates with a different formation scheme.
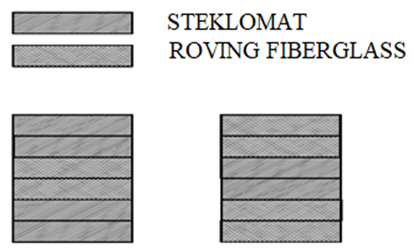
Fig. 1. Scheme of structural reinforcement of PCM plates
Table 1
Reinforcement structure of manufactured plates
|
Plate |
Total number |
Number of layers of roving glass |
Number of layers of glass wool |
|
I reinforcement scheme |
6 |
2 |
4 |
|
II reinforcement scheme |
6 |
4 |
2 |
The following patterns were selected for the preparation of the binder (polyester resin):
- 350 ml of polyester resin is consumed for each layer of reinforcing fiberglass (glass wool and roving glass);
- the curing process of PCM plates is carried out using a hardener methyl ethyl ketone peroxide (BUTANOX M-50) with a dosage ratio of 1 ml of hardener per 100 ml of polyester resin for all types of plates;
- the main indicators of the air conditioning atmosphere for all types of plates are the same and amount to 15 hours at an ambient temperature of 23°C and humidity of 50% [3].
After making the plates, they must be rolled with a center roller along and across the direction of the fibers to remove air from under the layers and evenly distribute the resin, after which the plates are left for 36 hours until completely dry under normal temperature conditions. After complete drying of the plates, mechanical treatment of the end surfaces is performed to remove excess fiberglass with resin.
For testing, samples are cut from sheet material, using a milling machine and a disk with a sawtooth edge made of hardened steel [4].
Tests of samples from PCM in order to determine their mechanical characteristics were carried out on certified testing machines at the Department of Ship-Mechanical Disciplines of the Caspian Institute of Marine and River Transport named after General-Admiral F. M. Apraksin.
Testing samples for three-point bending
Test samples are made according to the normative technical documentation. Testing PCM samples for static bending is carried out according to GOST 4648-2014, samples are made of rectangular shape with dimensions of length and width 200×20 mm (Fig. 2) [5].
According to the average thickness of the samples, the distance between the supports is determined by the formula L = (16 ± 1)h. The test samples are placed on supports and subjected to three-point bending at a constant speed until complete destruction, while measuring the destructive load applied to the sample. The recommended loading speed is 10 mm/min, this is due to the fact that PCM is a material that, when destroyed, does not show bending stress at maximum load (Fig. 3). The bending strength of PCM is determined by the formula

where Fmax - applied load, N; L - distance between the supports, mm; b - width of the sample, mm; h - thickness of the sample, mm.
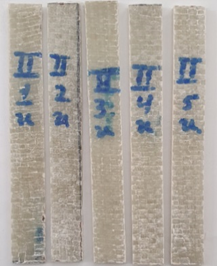
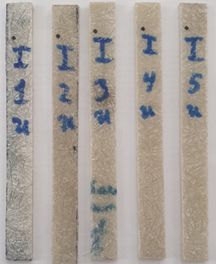
Fig. 2. Samples for testing three-point bending
The distance between the supports is determined by the formula
L = (16 ± 1)h.
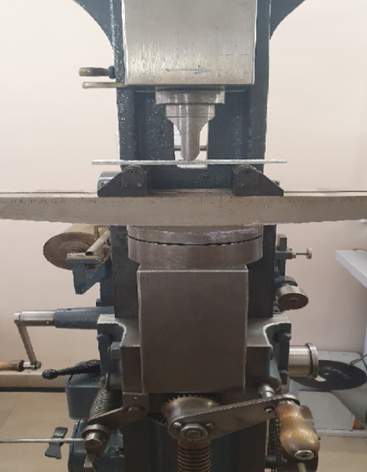
Fig. 3. Testing PCM samples on the R-5 machine
for a three-point bend
Comparison of the results of PCM tests for three-point bending shows that the (Table 2) average applied load of the samples of the I reinforcement scheme (Fig. 4) is greater than that of the samples of the II reinforcement scheme, but the average tensile strength of the samples of the II reinforcement scheme is higher (Fig. 5) than that of the samples of the I reinforcement scheme.
Table 2
Test results of samples for three-point bending
|
Sample Number |
Reinforcement scheme |
|||
|
I |
II |
|||
|
Fmax, kgp |
σ, MPa |
Fmax, kgp |
σ, MPa |
|
|
1 |
80 |
158 |
55 |
166 |
|
2 |
77 |
164 |
65 |
165 |
|
3 |
80 |
154 |
70 |
179 |
|
4 |
90 |
164 |
80 |
196 |
|
5 |
80 |
161 |
80 |
177 |
|
Average values |
81.4 |
160.2 |
70 |
176.6 |
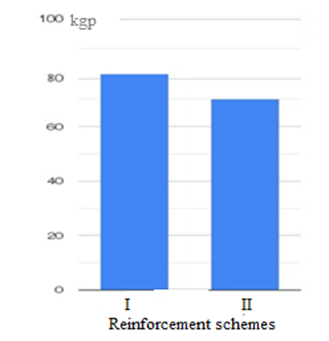
Fig. 4. Graph of the dependence of the average values
of destructive loads when testing samples
for three-point bending
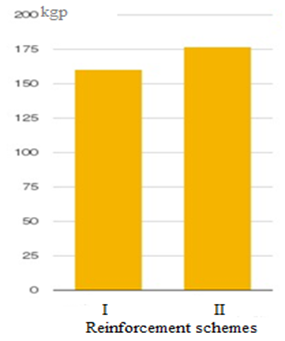
Fig. 5. Graph of dependence of the average values of the tensile strength when testing samples for three-point bending
Tensile testing PCM samples
Testing samples for tensile strength is carried out in accordance with GOST 11261-17, samples must be made of a flat shape with a length of more than 250 mm, a head width of 25 mm and a thickness of at least 2 mm. At least five samples are used for testing isotropic materials, and at least five samples are used for testing anisotropic materials, cut in the places and directions specified in the regulatory document or technical documentation for the material or agreed between the interested parties (Fig. 6) [6]:
![]()
 (1)
(1)
where Fmax - destructive load, N; A = bh – cross-sectional area of the sample, mm2.
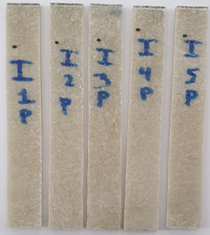
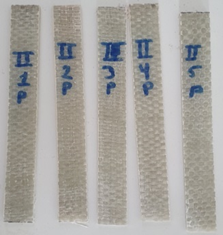
Fig. 6. PCM samples for tensile testing
The test samples are stretched along the axis at a constant speed of 5 mm/min; during the stretching process, the load sustained by the sample is measured, the destructive load and the tensile strength are determined (Fig. 7).
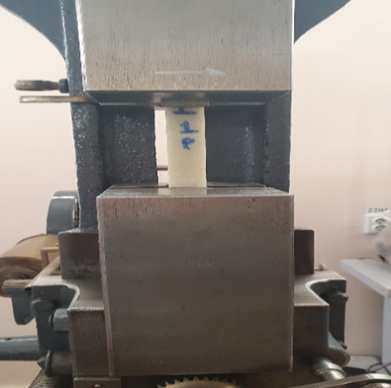
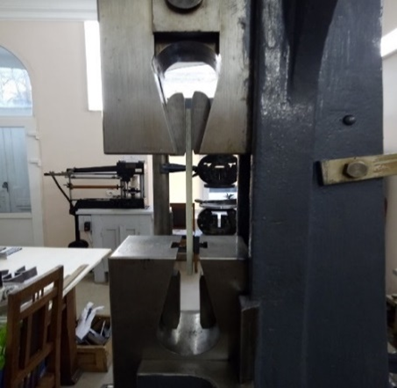
Fig. 7. Tensile testing PCM samples on the R-5 machine
A comparative analysis of the average values of the test results of the samples from the PCM tensile showed (Table 3) that the destructive load and tensile strength of the samples of the II reinforcement (Fig. 8, 9) scheme is an order of magnitude higher than that of the samples of the I reinforcement scheme.
Table 3
Results of tensile testing of PCM samples
|
Sample Number |
Reinforcement scheme |
|||
|
I |
II |
|||
|
Fmax, kgp |
σ, MPa |
Fmax, kgp |
σ, MPa |
|
|
1 |
1480 |
95 |
2150 |
177 |
|
2 |
2650 |
177 |
2210 |
182 |
|
3 |
2150 |
151 |
2125 |
181 |
|
4 |
2580 |
167 |
2250 |
191 |
|
5 |
1800 |
114 |
220 |
188 |
|
Average values |
2132 |
140.8 |
2187 |
183.8 |
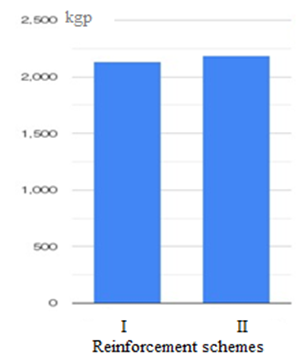
Fig. 8. Graph of dependence of the average values of destructive loads during tensile testing of samples
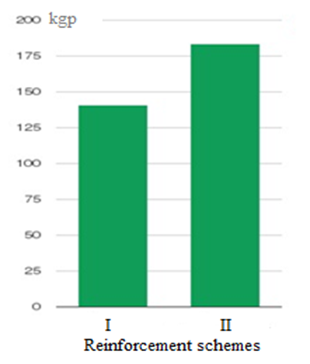
Fig. 9. Graph of dependence of the average values of the tensile strength during the tensile testing of samples
Compression testing of PCM samples
Compression test samples are manufactured, according to GOST 4651-2014 (Fig. 10). The manufactured samples have a square shape with dimensions of 10×10 mm and a thickness of at least 4 mm [7].
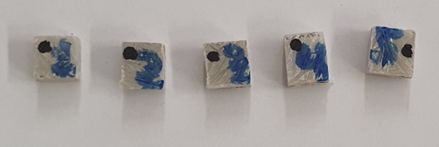
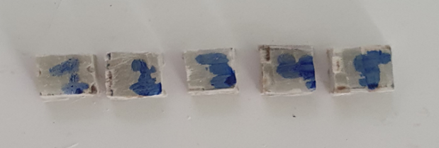
Fig. 10. PCM samples for compression tests
The test sample is compressed along its axis at a constant speed until it collapses or until the load decreases. The load applied to the sample is measured during the entire test process.
Polymer composite materials samples are installed in the center of the support platforms of the testing machine. During the testing process, it is recommended to use a thin sheet of sandpaper between the surfaces of the samples so that the samples do not slip on the support pads. The test samples are loaded by compression force (Fig. 11) perpendicular to the plane of laying the reinforcing layers on the R-5 testing machine with a recommended loading speed of 1 mm/min. The compressive strength of PCM samples is determined by the formula (1).
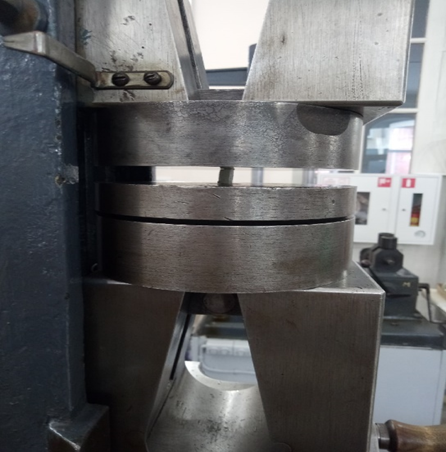
Fig. 11. Compression testing PCM samples
on the R-5 machine
A comparison of the average values of PCM samples for the destructive compression load showed (Table 4) that the destructive load and the tensile strength of the samples of the II reinforcement scheme (Fig. 12, 13) are an order of magnitude higher than the samples of the I reinforcement scheme.
Table 4
Results of compression testing of samples
|
Sample Number |
Reinforcement scheme |
|||
|
I |
II |
|||
|
Fmax, kgp |
σ, MPa |
Fmax, kgp |
σ, MPa |
|
|
1 |
2500 |
510 |
2950 |
592 |
|
2 |
2570 |
436 |
4100 |
902 |
|
3 |
2650 |
430 |
2650 |
492 |
|
4 |
2900 |
508 |
3070 |
616 |
|
5 |
2860 |
476 |
3400 |
631 |
|
Average values |
2696 |
472 |
3234 |
646.6 |
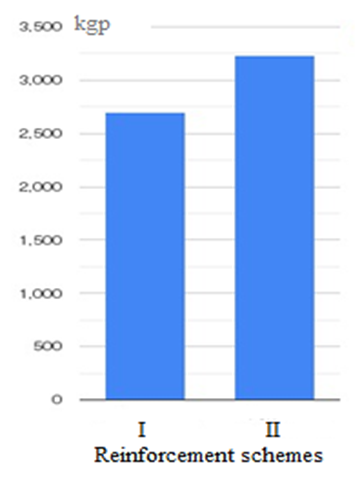
Fig. 12. Graph of dependence of the average values of destructive loads during compression testing of samples
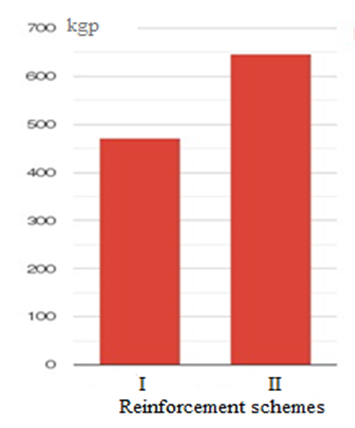
Fig. 13. Comparative analysis of the average values of the tensile strength of samples during compression testing
Conclusion
In the course of the research, mechanical tests of PCM samples with different reinforcement schemes were carried out, that is, a different quantitative ratio of layers of glass wool and roving glass and their binder polyester resin. The test results showed that with an increase in the number of layers of roving glass in the composition of the PCM, the destructive load and tensile strength, compression increases, but the values of the applied load of PCM samples decrease during three-point bending tests.
1. Мелешин М. А., Саламех Али, Алсаид Мазен. Опыт применения композиционных материалов в судостроении // Вестн. Астрахан. гос. техн. ун-та. Сер.: Морская техника и технология. 2022. № 2. С. 44-50.
2. Правила классификации и постройки морских судов. Ч. XVI. Конструкция и прочность корпусов судов из полимерных композиционных материалов. СПб.: Изд-во РМРС, 2019. 151 с.
3. Алсаид Мазен, Саламех Али. Способ изготовления образцов из многослойных композиционных материалов для изучения их механических свойств // Вестн. Астрахан. гос. техн. ун-та. Сер.: Морская техника и технология. 2018. № 4. С. 16-23.
4. Алсаид М., Саламех А., Мамонтов В. А. Исследование прочности судостроительного полимерного композиционного материала // Вестн. Гос. ун-та мор. и реч. флота им. адм. С. О. Макарова. 2019. Т. 11. № 3. С. 543-553.
5. ГОСТ 4648-2014. Пластмассы. Метод испытания на статистический изгиб. М.: Стандартинформ, 2014. 34 с.
6. ГОСТ 11262-2017. Пластмассы. Метод испытания на растяжение. М.: Стандартинформ, 2017. 24 с.
7. ГОСТ 4651-2014. Пластмассы. Метод испытания на сжатие. М.: Стандартинформ, 2014. 19 с.

