


Россия
Россия
Россия
На начальных этапах проектирования выполнение полного 3D-анализа процессов, происходящих в элементах систем охлаждения современных высокотемпературных двигателей, может быть либо очень затратным с точки зрения реализации вычислительных процессов, либо вообще невозможным в связи с отсутствием необходимых геометрических 3D-моделей на этих этапах проектирования. Но уже на начальных этапах проектирования очень важно максимально достоверно определять рациональные характеристики систем охлаждения элементов таких двигателей, поскольку зачастую именно на основании подобного рода оценок принимаются важнейшие технико-экономические решения, определяющие конечные характеристики проектируемого объекта. Исправить последствия некорректно принятых на данном этапе проектирования решений, если они будут приняты, бывает сложно и затратно, а в некоторых случаях невозможно. Обоснована актуальность использования критериальных уравнений, полученных различными авторами, для оценки необходимых параметров. Многолетняя практика применения подобных уравнений для выполнения инженерного анализа систем охлаждения подтвердила как высокую надежность получаемых результатов, так и относительно невысокие трудозатраты инженеров на выполнение работ, что позволяет значительно сократить время итераций, необходимое для принятия корректных технических решений, и достичь оптимальной конфигурации различных охлаждаемых элементов (корпусов, деталей камер сгорания, охлаждаемых лопаток и т. д.) в кратчайшие сроки. Выполнен сравнительный анализ характеристик элемента системы охлаждения турбомашины при использовании критериальных уравнений, полученных различными авторами. Отмечено достаточно хорошее совпадение результатов расчета коэффициента теплоотдачи при расчете по различным критериальным уравнениям и рассмотрена возможность использования данных критериальных уравнений в практических расчетах. Подчеркнута необходимость разработки программного модуля, использующего оптимизационные подходы для поиска рациональных параметров систем охлаждения, применяющих струйные методы организации движения охлаждающего воздуха.
турбомашина, струйное охлаждение, коэффициент теплоотдачи, высокотемпературная газотурбинная установка, охлаждаемая газотурбинная установка, тепловое состояние деталей
Introduction
Increasing the efficiency of modern gas turbine engines and units for virtually any purpose (aircraft, transport, marine, stationary, power generation, etc.) is closely linked to the need to increase the temperature of the working fluid upstream of the turbine. This, in turn, requires special attention to ensuring the operability of components operating in high-temperature parts, which cannot be achieved without the use of reliable calculation methods that allow for the reliably determination of heat transfer parameters for calculating the thermal state of the components. In the design of virtually any modern gas turbine engine, one of the most important systems is the cooling system, designed to cool engine components operating at high temperatures.
These cooled components can include turbine components (cases, disks, blades), as well as combustion chamber components such as liners, transition pieces, etc. There are a wide variety of cooling methods for components operating in high-temperature zones, but one of the most important is the jet cooling method, which combines high efficiency and relative ease of implementation.
For modern gas turbines, temperatures of 1 350-1 500 K behind the combustion chamber are well established. Almost all of them, such as the NK-14ST gas turbines series, or the NK-14E manufactured by UEC, the T-32 (MS5002E) manufactured by JSC REPH, and many others, have identical or even higher working gas temperatures before of the turbine. At these temperature levels, the operability of the unit's components can only be ensured with a sufficiently efficient cooling system.
Therefore, this article is not narrowly focused on marine applications. The information provided below can be considered by engineers working in the design of any high-temperature gas turbine units, regardless of their purpose, power output, shaft speed, etc.
The jet cooling method for turbine components is perhaps one of the most widely used in practice. The large number of different criterion equations and the wide variety of experimental methods used to obtain these criterion equations make it worthwhile to attempt a general comparison of the results obtained by various, well-known researchers.
Currently, a significant number of papers have been published containing experimental data, in which the authors have derived various criterion equations for calculating heat transfer parameters using the jet cooling method.
This paper presents a general comparative analysis of the calculated heat transfer coefficients for air cooling a flat surface using the jet cooling method.
Jet cooling method has been studied in numerous works by foreign [1-8] and domestic [9-11] authors. The data discussed in this paper are based on the results described in detail in [1-9].
Designation of the options under consideration
For ease of description and notation in the figures, the numerical notation system for the criterion equations of various authors is used, as shown in column 2 of Table 1. To perform a comparative analysis, subroutines were developed to calculate the main heat transfer characteristics using the criterion equations. The software modules are developed in C#.
Table 1
Numerical notation system for the criterion equations of various authors
|
Author |
Designation in the text |
Note |
|
L. W. Florschuetz, D. E. Metzger, |
В-1, В-2 |
B-1 – equation (10a) [5]; |
|
J. L. Chance [8] |
В-3 |
– |
|
D. M. Kercher, W. Tabakoff [7] |
В-4 |
– |
|
L. M. Zysina-Molozhen, L. V. Zysin, M. P. Poliak [9] |
В-5 |
– |
|
A. F. Slitenko [10] |
В-6 |
– |
A system of geometric notations describing the main parameters of the jet cooling system components
Cooling air jets are formed in holes of diameter d in the jet plate and strike the blown surface located at a distance Z from this plate. The flow, as a crossflow (relative to the jets), is directed along the blown plate toward the outlet section. The holes can be arranged transversely in either a corridor or a staggered pattern. A pressure differential exists between the cavity in front of the jet plate and the outlet section, causing the air flow under study (flow rate mc, Fig. 1). The location of the measuring probe for changing the pressure in the channel between the jet plate and the blown surface is shown in Fig. 2.
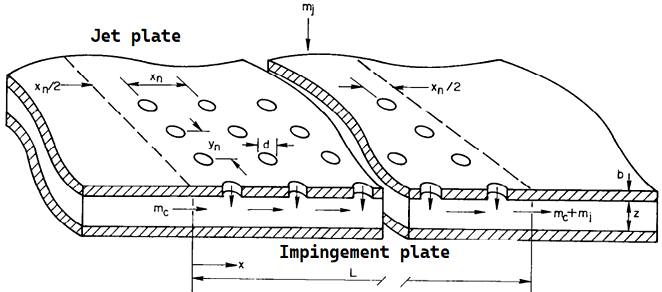
Fig. 1. Basic test model geometry and nomenclature
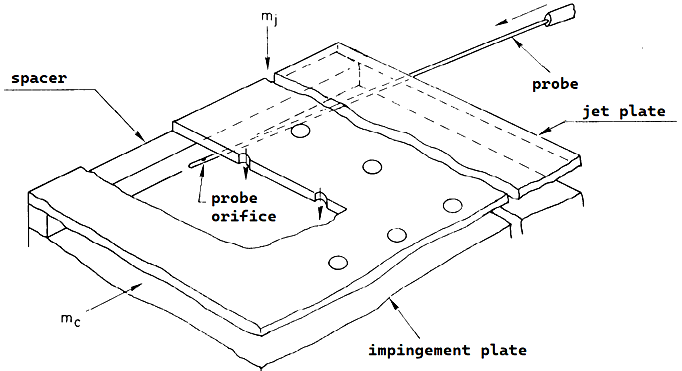
Fig. 2. Pressure measurement diagram
The criteria dependencies for the Nu number as a function of the Reynolds flow number in the jet for the considered series of orifices Rej used:
1) relative crossflow velocity Gc / Gj;
2) three geometric parameters related to the orifice diameter:
– streamwise jet hole spacing xn / d;
– spanwise jet hole spacing yn / d;
– channel height z / d.
In this paper these parameters were varied in the following ranges (to meet requirements B-1 and B-2):
– Rej = 2.5 ∙ 103 / 7 ∙ 104;
– Gc / Gj = 0 / 0.8;
– streamwise jet hole spacing xn / d = 5/15 for an inline pattern;
– streamwise jet hole spacing xn / d = 5/10 for a staggered pattern;
– spanwise jet hole spacing yn / d = 4/8;
– channel height z / d = 1/3.
The criteria dependencies for B-1–B-6 were used to develop the calculation software module written in C#.
Initial data for the software module and the results obtained
Below (Table 2) is a list of the initial data used to calculate the parameters of the jet cooling system. The list of results data obtained during the calculations is given in Table 3.
Table 2
Input data list
|
Parameter |
Note |
|
Air flow rate at the compressor inlet |
Used to estimate air rate for cooling |
|
Cooling air temperature |
– |
|
Cooling air pressure |
– |
|
Pressure drop at the end of the jet plate |
As a percentage of the air pressure supplied for cooling |
|
The type of hole arrangement on the jet plat |
Inline/staggered |
|
The diameter of the hole in the jet plate |
– |
|
Streamwise jet hole spacing |
xn / d = 5/15 for an inline pattern; xn / d = 5/10 for a staggered pattern |
|
Spanwise jet hole spacing |
yn / d = 4/8 |
|
Relative height of the channel |
z / d = 1/3 |
|
Number of holes in the streamwise direction |
– |
|
Number of rows of jet holes in the spanwise direction |
– |
|
Heat transfer coefficient on the gas side |
– |
|
Temperature of the gas from the side of the thermobarrier coating |
– |
|
Type of thermobarrier coating |
Selected from the database of thermobarrier coatings included in the software module |
|
Thickness of thermobarrier coating |
– |
|
Material of the metal (cooled) surface |
Selected from the database of metalls included in the software module |
|
Thickness of the metal (cooled) surface |
– |
|
Date of calculation |
Used to organize calculation result files |
|
Results file name |
– |
Table 3
List of data obtained during the calculations
|
Calculated parameter |
Note |
|
Surface temperature of thermobarrier coating on the gas side |
Distribution in streamwise direction |
|
Temperature between thermobarrier coating and metal |
Distribution in streamwise direction |
|
Metal temperature on the cooling air side |
Distribution in streamwise direction |
|
Mean metal temperature |
– |
|
Cooling air temperature |
Distribution in streamwise direction |
|
Total increase in cooling air temperature |
– |
|
Heat transfer coefficient of the cooling air |
Distribution in streamwise direction |
|
Cooling air rate |
For each of the rows in the spanwise direction |
Comparison of calculation results using criterial equations from different authors
The comparison of calculation results using criteria equations from different authors was performed using the same initial data, described below. Calculations were performed for three jet cooling variants of a gas turbine combustion chamber transition pipe section made of 5 mm thickness Nimonic-263.
The number of parameters that can be varied is quite large; however, for this case, we will limit ourselves to considering the calculation results for only one parameter: z / d – the channel height, i.e., the distance between the jet plate and the cooled surface (Table 4).
Table 4
Designation scheme for the calculated variants
|
Streamwise size |
Spanwise size |
Relative channel height |
Designation of design options in figures |
|
10 |
6 |
1 |
10-6-1 |
|
10 |
6 |
2 |
10-6-2 |
|
10 |
6 |
3 |
10-6-3 |
On the gas side, the surface of the transition piece is coated with a thermobarrier coating with a thermal conductivity coefficient of k = 1.15 W/(m·K). The surface is blown by a gas flow at a temperature of 1 500 K with a heat transfer coefficient on the gas side ∝g = 1 500 W/(m2·K).
To provide jet cooling for the transition pipe, a screen with ny = 5 rows of nx = 15 holes with a diameter of d = 2 mm, spaced x / d = 10 along the flow, is installed at a distance of Z (Fig. 1). The rows of holes spanwise the flow are spaced y / d = 6 apart. The order of the holes on the jet screen is inline. For ease of analysis of the results, a coding system for the jet cooling design variants is adopted, as described in Table 4.
Cooling air is supplied from the compressor discharge cavity at a temperature of 731.6 K. Cooling air pressure at the compressor discharge corresponding to the pressure before the jet plate, is 15.72 bar. The pressure drop at the end of the last downstream row of holes in the jet plate is 1.5% of the pressure at the compressor discharge.
Thus, the total area of the transition piece surface fragment cooled by jet cooling is

Figures 3-5 show the results of comparative calculations.
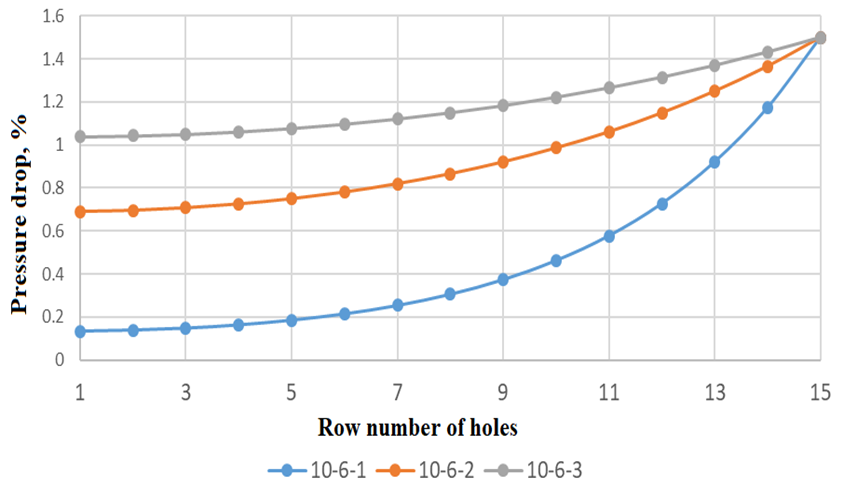
Fig. 3. Pressure drop across the jet plate holes
As can be seen from the data in Fig. 3, the distance from the jet plate to the cooled surface, all other parameters being equal, significantly affects the pressure drop across the jet plate, which leads to significant changes in cooling air flow rate, jet velocities, etc.
As test calculations for variants 10-6-1, 10-6-2, and 10-6-3 show, the heat transfer coefficients for B-6 are significantly (2.5-3 times) higher than those obtained from the data of the other five authors. Thus, the data from [10] differ significantly from those of the other authors, which, in general, correlate well with each other. Only the calculation results from the nine literature sources [1-9] (Table 1), with the exception of B-6, are discussed below.
a
b
c
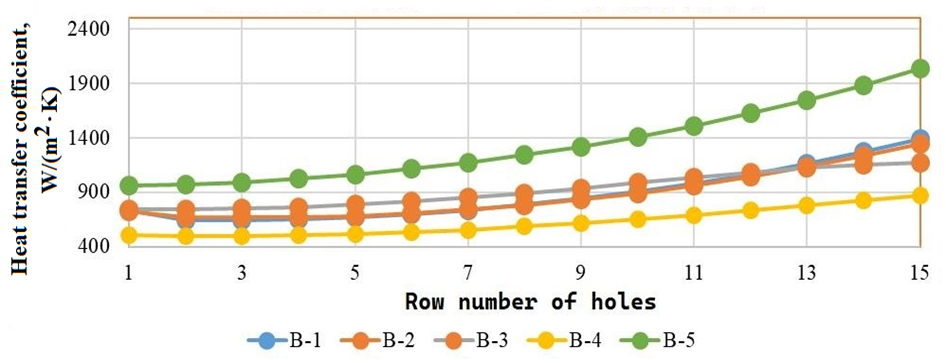
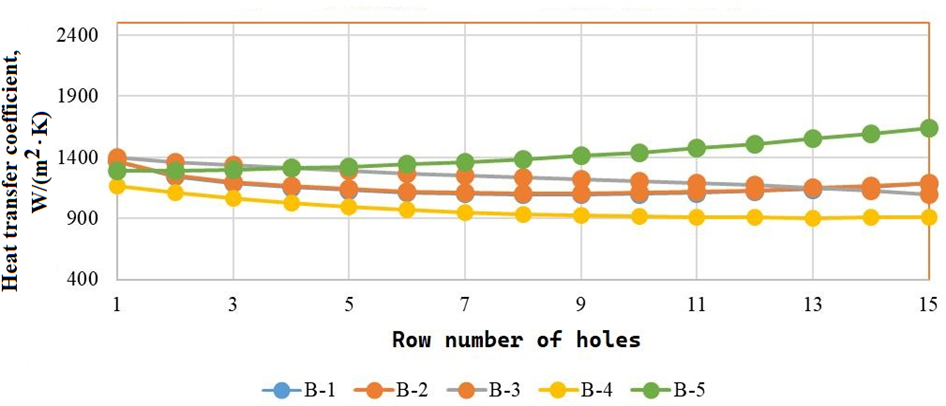
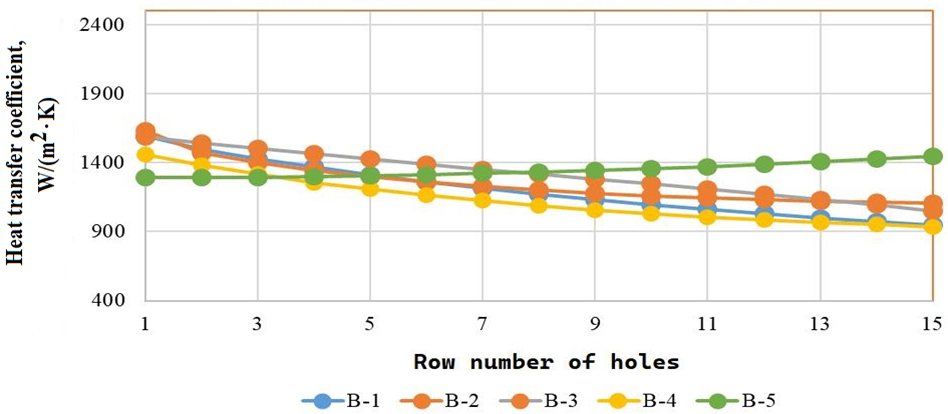
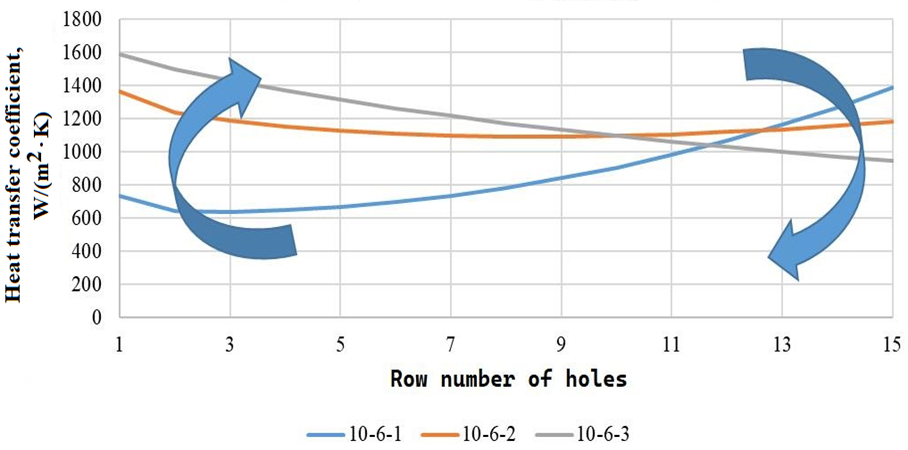
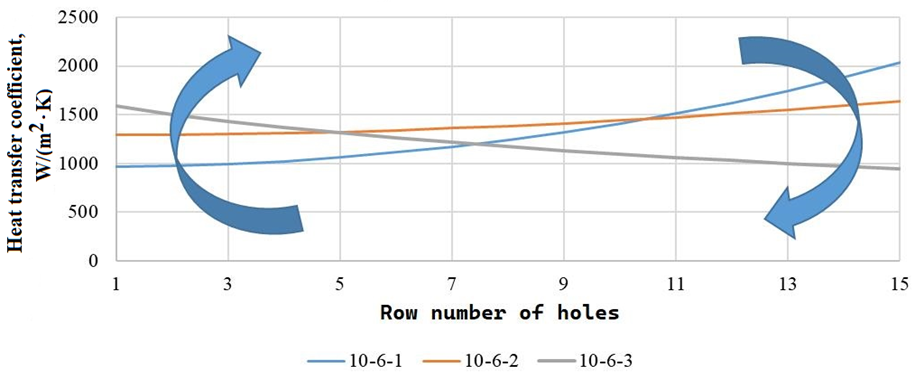
Fig. 4. Heat transfer coefficients distribution: a – for 10-6-1; b – for 10-6-2; c – for 10-6-3
a
b
Fig. 5. Heat transfer coefficients for different z / d: a – calculated by B-1; b – calculated by B-5
Overall, good agreement can be noted between the calculated heat transfer coefficient data obtained from various literary sources. Obviously, the thermal state calculation data based on these criteria equations will be very close.
Conclusion
1. The heat transfer coefficients calculated using data from [10] for B-6 are significantly (2.5-3 times) higher than those obtained using data from other authors [1-9].
2. The heat transfer coefficients calculated using data from five different sources for B-1–B-5 correlate well with each other (Fig. 4), and the temperature state of the cooled surfaces calculated using the jet method from these sources will differ only slightly. Higher values are obtained for B-5.
3. Increasing the distance between the jet plate and the cooled surface significantly increases the pressure drop across the first rows of holes (Fig. 3), which leads to an increase in the jet flow velocity through them and increases the cooling intensity under the first rows of holes (see left arrows in Fig. 5).
4. Due to the increase in the speed of the jet flow through the first rows of holes with an increase in the distance between the jet plate and the cooled surface, the flow rate (and speed) of the cross-flow of air along the flow increases, which reduces the efficiency of the jet effect for subsequent rows and reduces the heat transfer coefficients under them (see right arrows in Fig. 5).
1. Metzger D. E., Florschuetz L. W., Takeuchi D. I., Be-hee R. D., Berry R. A. Heat transfer characteristics for inline and staggered arrays of circular jets with crossflow of spent air // ASME Journal of Heat Transfer. 1979. V. 101. P. 526–531.
2. Florschuetz L. W., Metzger D. E., Takeuchi D. I., Ber-ry R. A. Multiply jet impingement heat transfer characteristics – Experimental investigation of inline and staggered arrays with crossflow. NASA-CR-3217. Department of mechanical engineering, Arizona State University, Tempe, 1980. P. 83.
3. Florschuetz L. W., Metzger D. E., Truman C. R. Jet array impingement with crossflow – correlation of streamwise resolved flow and heat transfer distribution. NASA-CR-3373. Department of mechanical engineering, Arizona State University, Tempe, 1981. P. 54.
4. Florschuetz L. W., Metzger D. E., Su C. C., Isoda Y., Tseng H. H. Jet array impingement flow distributions and heat transfer characteristics effects of initial crossflow and nonuniform array geometry. NASA, 1982. P. 177.
5. Florschuetz L. W., Metzger D. E., Truman C. R. Streamwise flow and heat transfer distributions for jet array impingement with crossflow. N. Y.: ASME 345, 1982. P. 10.
6. Florschuetz L. W., Isoda Y. Flow distributions and discharge coefficient effects for jet array impingement with initial crossflow. N. Y.: ASME 345, 1982. P. 10.
7. Kercher D. M., Tabakoff W. Heat transfer by a square array of round air jets impinging perpendicular to a flat surface including the effect of spent air // ASME Journal of Engineering for Power. 1970. V. 92. P. 73–82.
8. Chance J. L. Experimental investigation of air im-pingement heat transfer under an array of round jets // Tappi Journal. 1974. V. 57. N. 6. P. 108–112.
9. Зысина-Моложен Л. М., Зысин Л. В., Поляк М. П. Теплообмен в турбомашинах. Л.: Машиностроение, 1974. 336 с.
10. Слитенко А. Ф. Исследование теплообмена тур-бинных лопаток оболочкового типа с воздушным охлаждением: автореф. дис. … канд. техн. наук. Харьков, 1968. 15 с.
11. Швец И. Т., Дыбан Е. П. Воздушное охлаждение деталей газовых турбин. Киев: Наукова Думка, 1974. 488 с
