


Russian Federation
Russian Federation
European vendace in the Kaliningrad Region is represented only in Lake Vishtynetskoe. It is a valuable com-mercial species and it was actively used by fishing in the 70-80s of the 20th century. Its annual catch reached 29 tons with an average catch of 16 tons. However, currently catches of this fish do not exceed 2 tons while a recommended volume is 12 tons. Modern studies have shown a decrease in size characteristics and a high vendace population in Lake Vishtynetskoe. In order to increase the efficiency of targeted fishing for this species in a reservoir and determine areas of the water area in which it forms high concentrations, its spatial distribution was studies over the period from 2014 to 2021 by conducting night hydroacoustic surveys. Processing of echograms made it possible to obtain quantitative characteristics of the densities of vendace aggregations along the ship’s route. By using of geographic information systems for each section of lake, for which fishing squares were selected, the average concentration of this species were determined. An average density of aggregations for the considered series of years, amounting to 10,000 specimens/ha, was chosen as a measure of high concentration. The results of the studies showed that in different years high densities of vendace aggregations are formed in different parts of the lake and the number of population does not reliably affect the number of such ar-eas. Spatial analysis showed that during the period under review consistently high concentrations of this species were observed annually in only two fishing squares and its can be recommended for targeted vendace fishing.
European vendace (Coregonus albula L.), Lake Vishtynetskoe, hydroacoustic method, spatial distribution, cluster density, abundance, fishing square
Introduction
European vendace (Сoregonus albula (L., 1958)) is a valuable commercial object with high nutritional value. In the Kaliningrad region this species is represented only by a residential form living in Lake Vishtynets-
koe [1]. Vendace was actively used by fisheries in this reservoir in the 70-80s: catches reached 29 tons, average catches were 16 tons per year [2]. However, the decline of the fishery in the 90s and its gradual resumption in the 2000s showed an 8-10-fold decrease in catch volumes. As it turned out, the drop in catches is not associated with the decrease of the number of vendace, according to available estimates the catch values can reach 18 tons [2, 3], but is caused by changes in its size structure: a decrease in the body length of this species has led to the impossibility of entangling it with fixed nets with a mesh size 18 mm, which were used by fishing organisations [4]. Reducing the minimum mesh size in the Fishing Rules [5] to 14 mm made it possible to slightly increase the volume of catch of this species in Lake Vishtynetskoe. Currently catch volume is about 2 tons while a recommended catch volume is 12 tons [6].
It is known that the efficiency of fishing, among other things, depends on the fish concentrations, the stability and places of formation of these aggregations [7, 8]. In this regard increasing of vendace catches can be facilitated by identifying areas of water area of Lake Vishtynetskoe in which high densities of vendace aggregations are observed annually. From the point of view of managing aquatic biological resources it is most convenient to use the existing division of the lake into fishing squares. During assessment of fishing areas, it is necessary to take into account the fact that the spatial distribution of vendace is influenced by abiotic and biotic factors and its effect can vary greatly from the year to year.
The purpose of this work is to study the long-term dynamics of the spatial distribution of vendace in Lake Vishtynetskoe and to identify fishing areas in which fishing is most appropriate from the point of view of the formation of high concentrations of vendace in them.
Material and research methods
The material for this work was long-term data of hydroacoustic surveys conducting on Lake Vishtynetskoe in July during the period of 2014-2021. The surveys were carried out in night time using the AsKor software and hardware complex [9]. In this period of time vendace makes vertical migrations from the bottom into the water column to provide itself with food and form in this moment multiple aggregations that are easily detected by the hydroacoustic complex [10]. Vendace is the dominant species in the water column of Lake Vishtynetskoe both in terms of numbers (97%) and biomass (95%) [4]. This allows the echo signals recorded by the hydroacoustic complex in the water layer above 2-3 m from the bottom to be considered as belonging to this species.
The methodology of conducting of hydroacoustic surveys on Lake Vishtynetskoe consisted from three stages: data collection, desk processing of the received data and its further analysis including spatial processing by geographic information systems.
The data collection stage consisted of conducting of hydroacoustic survey along the planned route using meander-type leg pattern in the direction from the northern part of the lake to the southern part with first leg along the border with the Republic of Lithuania and back with a shift towards the shore of the Russian part of lake [2]. The survey was carried out using the data collection software of the research hydroacoustic complex for vertical sounding named AsKor based on Furuno LS-4100 echo sounder [9]. The obtained data was recorded in files in the form of echograms.
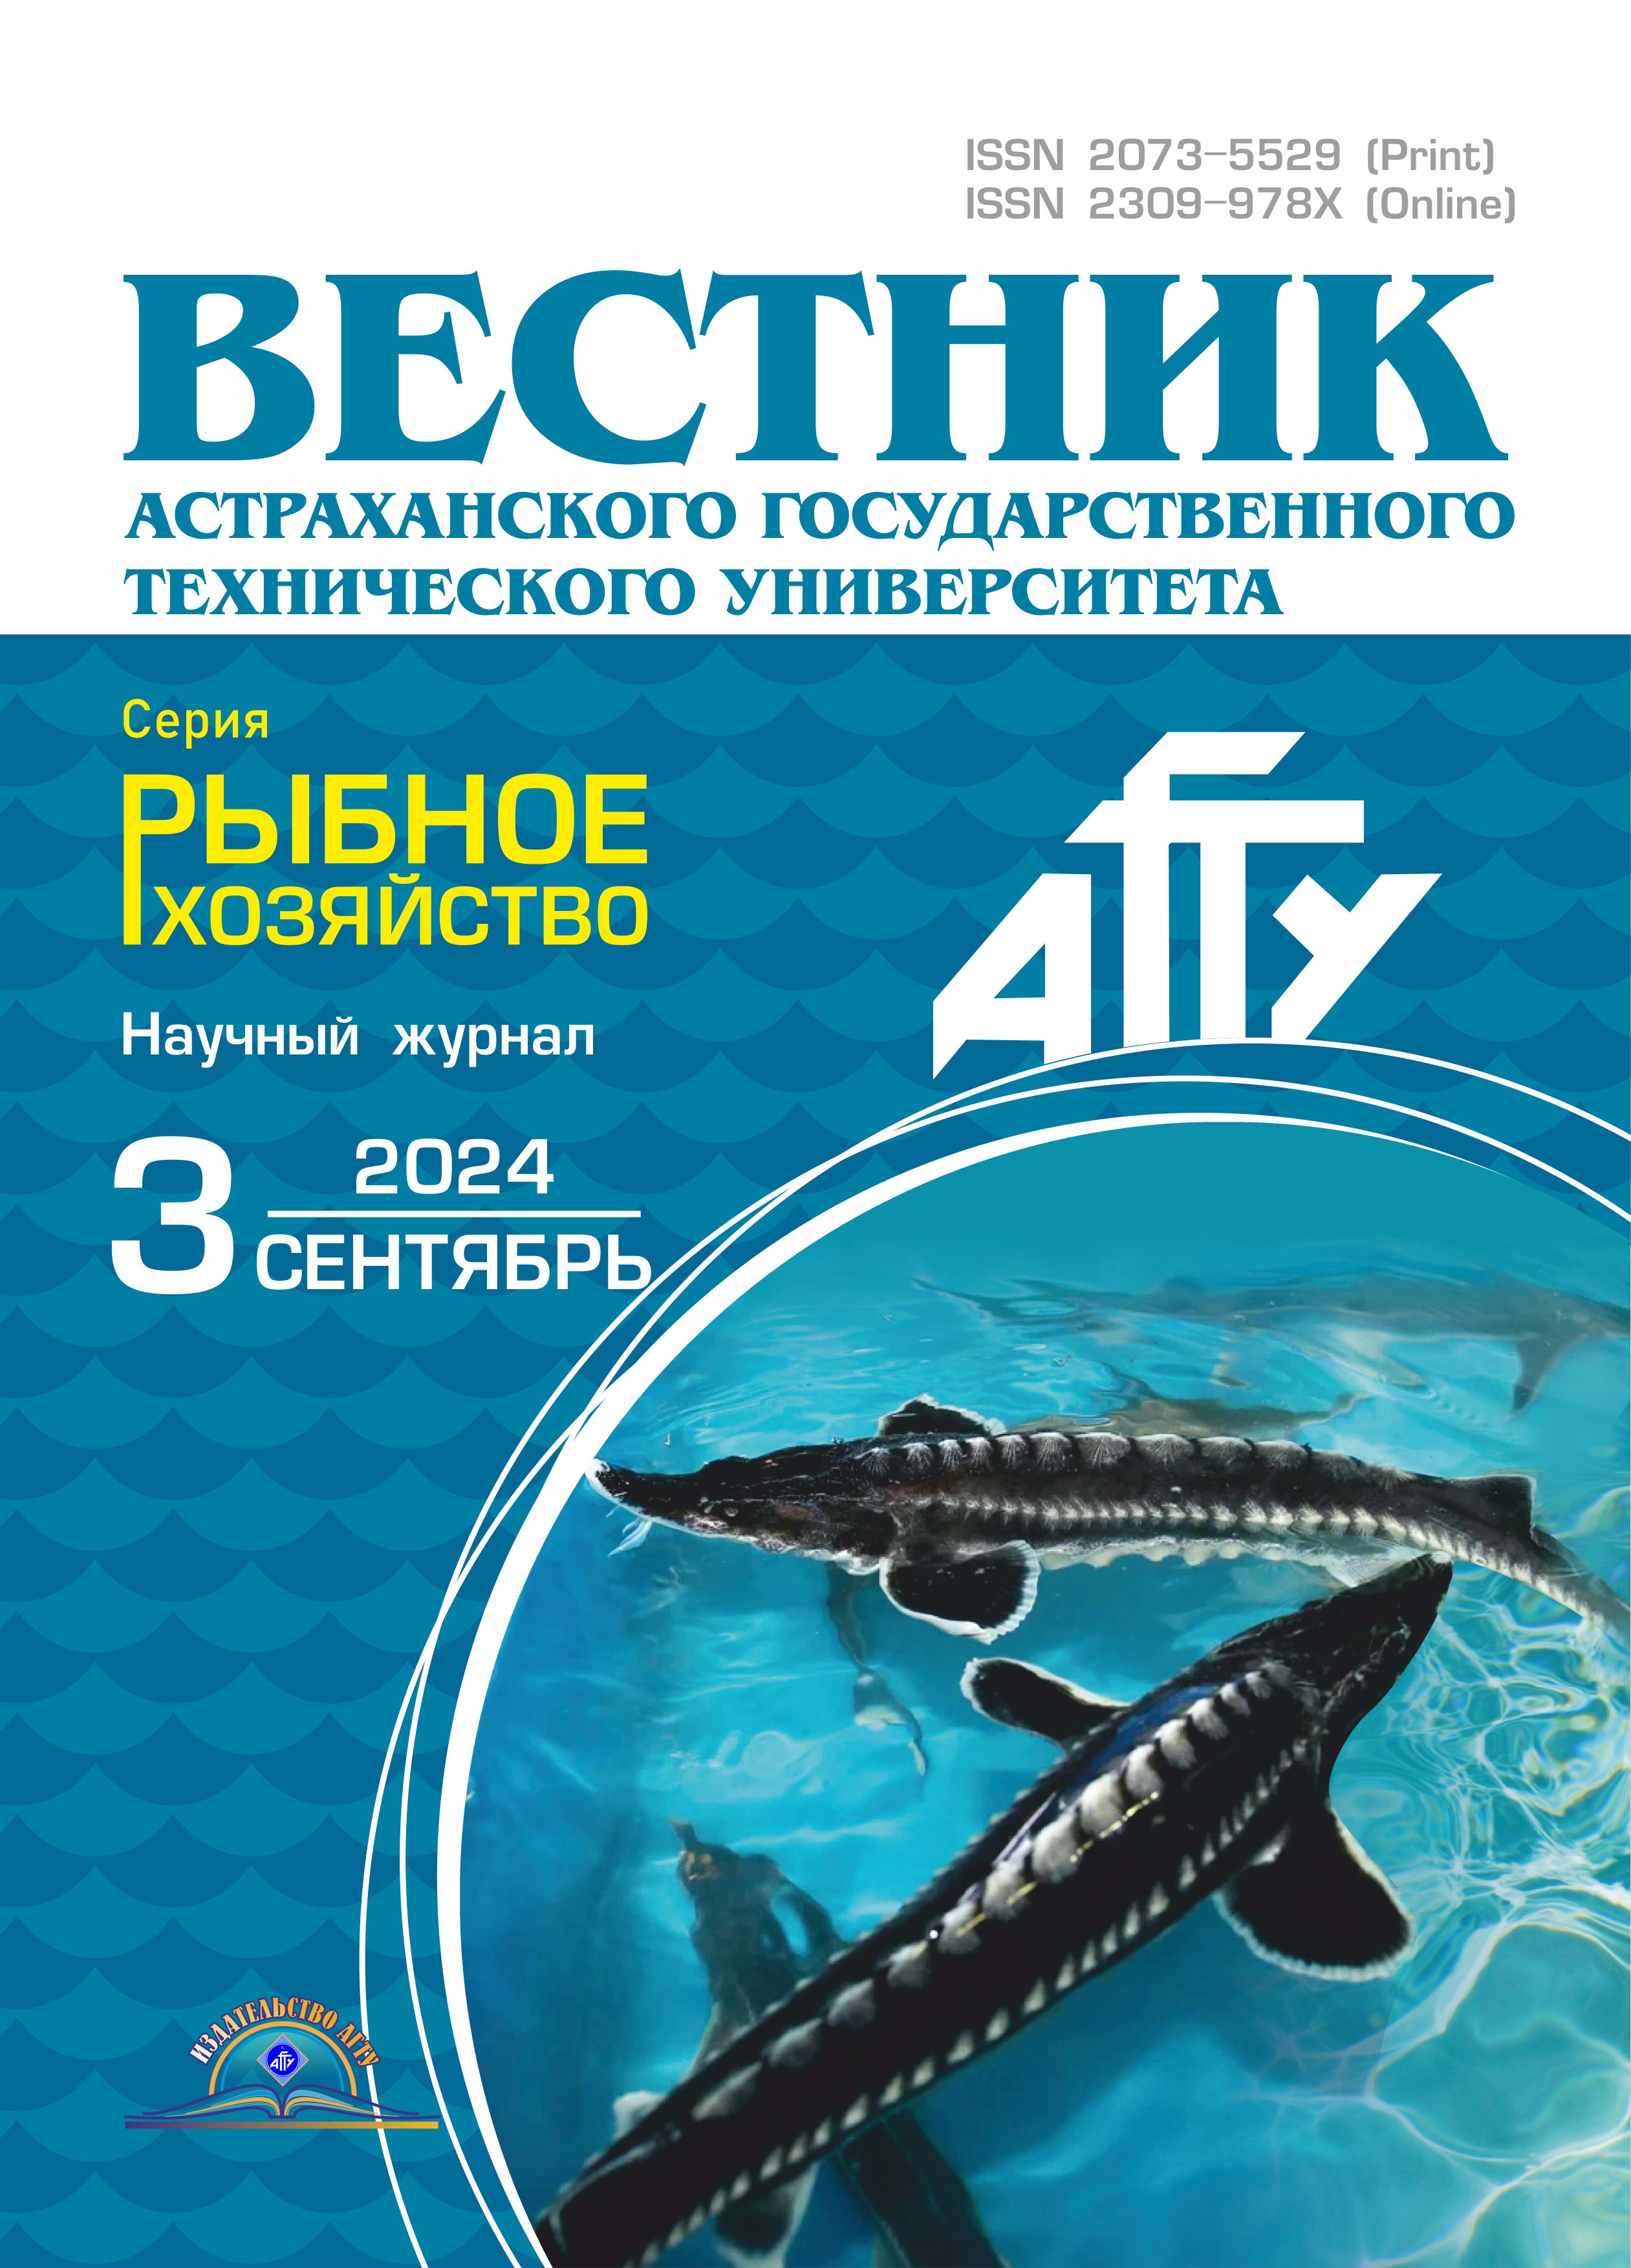
Desk data processing was carried out using the processing software of the AsKor complex. Each file obtained during a hydroacoustic survey was divided into pages of 15 frames each (Fig. 1).
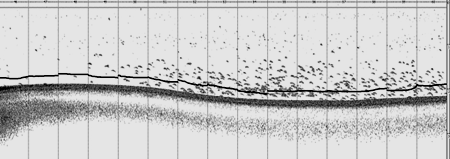
Fig. 1. Page division on frames
with bottom line correction
Each frame is formed by 100 echo sounder messages, which approximately corresponds to 33 seconds of real time or 70 m of distance travelled. For each of them the bottom line was manually adjusted to the distance of 2-3 meters above its actual position in order to avoid counting by hydroacoustic equipment representatives of the bottom fish community (Fig. 2).

Fig. 2. Fragment of the echogram frame processing window
Frame-by-frame file processing was performed at a frequency of 200 KHz. The result of it was the obtaining of quantitative values of vendace densities (in terms of unit area (hectare)) with their spatial reference. This and a number of other information were recorded in text files for further analysis of this information by spreadsheets software.
The next stage of data processing was carried out using the geographic information system QGIS and consisted of spatial analysis, aggregation and visualization of the obtained spatially distributed values of recorded hydroacoustic parameters in order to determine the average vendace concentrations for each fishing square.
The files obtained when processing echograms contain information about the coordinates of the place and a quantitative assessment of the density of vendace aggregations in it along the entire route of the vessel. This made it possible to use these data for their visualization in the form of a GIS point objects layer (Fig. 3, a) where the results of frame processing are presented in the attribute table of this layer (Fig. 3, b) [11].
|
а |
 b
|
|
Fig. 3. A layer of point objects with information about the coordinates and density of fish aggregations (a) |
|
Analysis of the spatial distribution of vendace of Lake Vishtynetskoe was carried out on the basis of the existing division of the lake into fishing squares which are used to manage aquatic biological resources.
The digitized contour of Lake Vishtynetskoe and the boundaries of fishing squares which are presented in the form of separate GIS layers allows to use them for spatial analysis of hydroacoustic information. Using the aggregation operation and the available layers the average density of vendace aggregations for each fishing square was calculated and recorded in the attribute table of this layer.
Research results and discussion
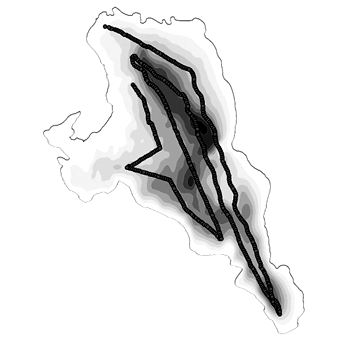
In order to study the spatial distribution of vendace across the water area of Lake Vishtynetskoe data collected during night hydroacoustic surveys using the AsKor software and hardware complex were used. The density aggregation values of this species were calculated for each fishing square and were conditionally divided into seven ranges: 0-1,000, 1,000-2,500, 2,500-5,000, 5,000-10,000, 10,000-15,000, 15,000-20,000, 20,000-100,000 specimens/ha.
The results of the analysis based on 2021 data shows that the highest density of aggregations in this year was 15-20 thousand specimens/ha and was observed in the fishing square with number 31 which is located in the northern part of the lake at depths of 30-40 meters. Lower concentrations with a density of aggregations of 10,000-15,000 specimens/ha were observed in the northern, central and south-central parts of the lake in
4 fishing squares. In the northern and central parts of the lake the predominant depths were 35-45 meters, in the south-central part – 30-40 meters (Fig. 4). Quantitative characteristics of the main parameters of the 2021 hydroacoustic survey, which characterize the density of vendace aggregations and its population, are presented in Table 1.

Fig. 4. Spatial distribution of vendace in Vishtynetskoe Lake according to hydroacoustic survey data of 2021
Table 1
Quantitative characteristics of the main indicators of hydroacoustic survey in 2021
|
Year |
Number, |
Average density, specimens/ha |
Minimum density, specimens/ha |
Maximum density, specimens/ha |
|
2021 |
9.70 |
9.800 |
21 |
36.501 |
In order to solve the problem of identifying fish squares in which high concentrations of vendace are observed it is necessary to select a criterion that allows to determine which values of vendace concentrations are considered high and which are not. In this regard, the average density of aggregations obtained from the results of night hydroacoustic surveys over a number of years was taken and was rounded to the nearest threshold range amounting 10,000 specimens/ha. Taking this into account in 2021 five fishing squares can be identified in which high concentrations of vendace were observed: 30, 31, 40, 41 and 82.
Despite the fact that vendace is generally confined to the deep-water areas of Lake Vishtynetskoe, the influence of abiotic and biotic factors on its spatial distribution may vary from year to year. In turn this can lead to the formation of aggregations with different density in the same parts of lake. In order to confirm this hypothesis and identify water body areas (in the form of fishing squares) in which high density concentrations of this species are always formed (over the series of observations), an analysis of its spatial distribution over several previous years was carried out.
Thus, in 2020, high densities of vendace aggregations were observed in 14 fishing squares including south part of the lake, where high concentrations of this species in 2021 were not registered. In 2019 high densities of vendace aggregations were observed in 19 fishing squares, mainly in the northern and central parts of the lake at depth from 15 to 40 meters (Fig. 5).
|
|
|
||
|
Fig. 5. Spatial distribution of vendace in Vishtynetskoe Lake according |
|||


Table 2
Quantitative characteristics of the main indicators of hydroacoustic surveys in 2019 and 2020
|
Year |
Number, |
Average density, specimens/ha |
Minimum density, specimens/ha |
Maximum density, specimens/ha |
|
2019 |
9.82 |
10.917 |
17 |
36.078 |
|
2020 |
7.22 |
7.719 |
13 |
22.656 |
The results show that the number of fishing squares with high concentrations of this species in 2020 turned out to be higher and dense aggregations were also observed in south part of the lake despite the decrease in the number of vendace, the average and maximum density of its aggregations in 2020 compared to 2021. In 2019 the indicators were generally comparable with 2021 (with the exception of a slightly higher average density and population in 2019), however, there were an even greater number of water areas with high concentrations of vendace and the presence of dense aggregations of this species in the northern part of the lake.
In 2018 high densities of vendace aggregations were observed in 29 fishing squares which occupied most of the water area of Lake Vishtynetskoe and were confined to areas of the lake with depths of more than 15 meters. In 2017 high concentrations of this species were observed in 17 fishing areas, mainly in the central and southern parts of the lake at depths from 20 to 45 meters (Fig. 6).
|
|
b |
|
Fig. 6. Spatial distribution of vendace in Vishtynetskoe Lake according
|
|
 a
a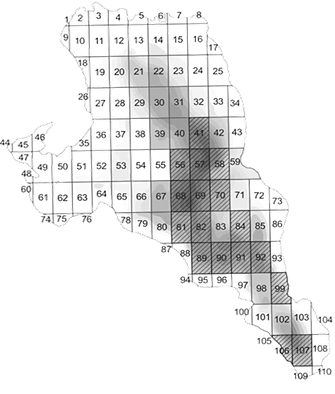
Quantitative characteristics of the main parameters of hydroacoustic surveys in 2017-2018 are presented in Table 3.
Table 3
Quantitative characteristics of the main indicators of hydroacoustic surveys in 2017 and 2018
|
Year |
Number, |
Average density, specimens/ha |
Minimum density, specimens/ha |
Maximum density, specimens/ha |
|
2017 |
9.17 |
9.801 |
15 |
33.460 |
|
2018 |
13.21 |
14.500 |
25 |
41.355 |
They show that in 2018 a high number of vendace was observed and there was an increase of the main indicators of the density of its aggregations (average and maximum). Of course, this influenced the formation of high density concentrations in almost all deep-water areas of Lake Vishtynetskoe – the number of fishing squares with high density aggregations was the greatest and was observed in all parts of the lake with depth of more than 15 meters (compared to 2019-2021). In 2017 the population of this species, as well as the average and maximum density of its aggregations were slightly lower than 2019 and 2021. At the same time the number of fishing squares with high concentrations of vendace was 17, which is generally comparable with 2019. However, in 2019 high aggregations were observed in northern and central parts of the lake, and in 2017 – in the central and southern parts. In 2016 high concentrations of vendace were observed in 12 fishing squares, which were dispersed throughout the water area of Lake Vishtynetskoe and fell at depths of 20-45 meters. In 2014 dense concentrations if this species were found in 27 fishing squares, also distributed throughout the entire waterbody, mainly in depths of 15-45 meters (Fig. 7).
|
|
|
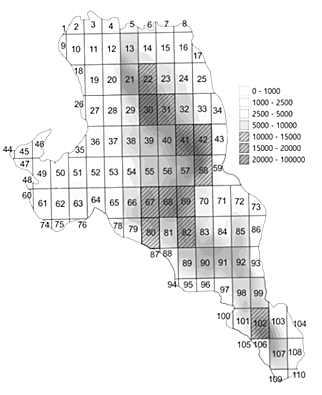

Fig. 7. Spatial distribution of vendace in Vishtynetskoe Lake according
to hydroacoustic surveys data of 2016 (a) and 2014 (b)
Quantitative characteristics of the main parameters of hydroacoustic surveys in 2016 and 2014 are presented in Table 4.
Quantitative characteristics of the main indicators of hydroacoustic surveys in 2014 and 2016
|
Year |
Number, |
Average density, specimens/ha |
Minimum density, specimens/ha |
Maximum density, specimens/ha |
|
2014 |
14.58 |
14.127 |
59 |
45.252 |
|
2016 |
11.30 |
11.098 |
43 |
33.943 |
Thus, despite the higher number of vendace in 2016 compared to 2019, the average density of its aggregations were generally comparable in the indicated years, and the maximum density in 2016 was slightly lower than the same parameter in 2019. The distribution over the water area also differed: in 2016 high concentrations were observed in northern, central and southern parts of the lake, while in 2019 – only in the central and northern parts. In 2014 the highest number of vendace was observed during the study period – 14,58 million specimens, while the average and maximum density of aggregations were generally comparable to the level of 2018. The distribution of high-density vendace aggregations throughout the water area was similar as well as the number of fishing squares with high concentrations of this species. However, it can be noted a smaller number of fishing squares compared to 2018 despite the large number. The results of the studies show that while the number of vendace is high (more than 13 million specimens) this species forms dense aggregations throughout the water area with depths of more than 15 meters. With a lower abundance the number of areas of the water body (fishing squares) with high concentrations of this species and their spatial location differ from year to year. In order to confirm the observations stated above, we will determine whether the increase in the number of vendace leads to an increase in the average density of its aggregations in the water column, and also whether there is a direct connection between the abundance of this species and the number of fishing squares in which high densities of its aggregations were recorded. The influence of vendace abundance on the formation of high concentrations in the water columns was assessed by statistical analysis using the Pearson linear correlation coefficient. The results of the analysis showed the presence of a direct relationship between the quantitative characteristic of the density of vendace aggregations and its abundance (r = 0.966, tfact = 8.388, ttable = 2.570, p = 0.05) (Fig. 8), that is the average density of aggregations of this species grows with an increase in the number of vendace.

Fig. 8. The relationship between the number and average density aggregations of vendace
In order to determine the influence of vendace population on the formation of high concentrations in different parts of the water area of Lake Vishtynetskoe (the number of fishing squares with high density of aggregations) a statistical analysis was also carried out using the Pearson linear correlation coefficient. Moreover, this was done for two ranges of values: for the entire period of years (r = 0.683, tfact = 2.088, ttable = 2.570, p = 0.05) (Fig. 9, a) and for the period, excluding two years with high vendace population (over 13 million specimens)
(r = –0.156, tfact = 0.352, ttable = 2.570, p = 0.05) (Fig. 9, b).
 |
|
|
Fig. 9. The relationship between the number and count of fishery squares with high concentration of vendace:
|
|
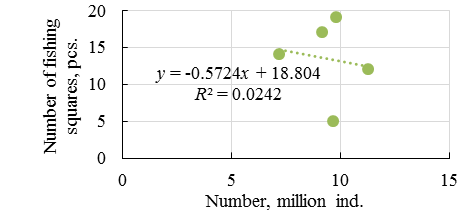
As it can be seen from the obtained results in both cases there is no statistically significant linear relationship between the vendace population and water body areas in which high concentrations of vendace are formed (despite the fact that in accordance with the Chaddock scale this relationship for the entire series of years can be considered as average). The absence of dependence is also confirmed by a comparative analysis of the results of the spatial distribution of vendace in accordance with hydroacoustic survey data, for example, 2020 and 2021. Thus, in 2020 the smallest population of vendace was observed (7,22 million specimens), however, the number of fishing squares in which high density aggregations is registered was almost 3 times greater compared to 2021. All this indicates that some other factors influence on formation of high vendace concentrations in water column and the number of water body areas (fishing squares) with high density of aggregations (over 10,000 specimens/ha) does not depend on the vendace population.
In order to identify fishing squares in which high densities of vendace aggregations were observed annually, a spatial analysis of hydroacoustic information was carried out for the available series of years. The results showed that during the period under review constantly high concentrations of this species were observed only in two fishing squares – 41 and 82, which are located in central and south-central parts of the lake at depths 30-50 meters (Fig. 10).

Fig. 10. Fishery squares with annual density
of vendace more than 10 thousand specimens/ha
The obtained result indicates that the factors influencing the formation of high concentrations of vendace in these areas of the lake are the most favorable, and their interannual dynamics are most likely not very pronounced (compared to other fishing squares). In the future, in order to identify the reasons causing the spatial distribution of high concentrations of individuals of this species across Lake Vishtynetskoe it is planned to conduct additional research to determine the factors and the degree of their influence on the formation of high-density aggregations of vendace. The main parameters to be studied are the following: distribution of food organisms (plankton), temperature water stratification, content of dissolved in water oxygen, depth of place. But now it can be said that in the found fishing squares fishing seems to be the most promising (at least in the summer time).
Conclusion
The results of the studies showed interannual variability in the spatial distribution of vendace dense aggregations (over 10,000 specimens/ha) across the water body of Lake Vishtynetskoe: in some years, individuals of this species were concentrated in the northern and central parts of the lake, in others – in the central and southern, in some years high concentrations were observed in all parts of the lake. With a sufficiently high population (more than 13 million specimens) of vendace the number of such areas throughout the waterbody is quite large (more than 25 fishing squares), while at lower values the number of fishing squares with high concentrations can vary from several to one or two dozen pieces. Correlation analysis showed the absence of a statistically significant (p = 0.05) linear relationship between the vendace population and the number of water body areas with a high density of vendace aggregations. However, from year to year over the period under consideration high concentrations of this species were observed in two fishing squares located in central and south-central parts of the lake at depths 30-50 meters. Of course in order to more effectively use vendace stocks of Lake Vishtynetskoe it is necessary to determine the factors influencing the spatial distribution of dense aggregations of this species throughout the water area of the lake but already now the selected areas of the water area can be recommended for conducting targeted fishing of vendace, at least, during the summer period.
1. Borovikova E. A. Morfologicheskie osobennosti ria-pushki Coregonus albula ozera Vishtynetskoe (Kali-ningradskaia oblast') [Morphological features of the grouse Coregonus albula of Lake Vishtynetskoye (Kaliningrad region)]. Ekologicheskii sbornik 5: trudy molodykh uchenykh Povolzh'ia: Mezhdunarodnaia nauchnaia konferentsiia (Tol'iatti, 11–12 marta 2015 g.). Tol'iatti, Kassandra Publ., 2015. Pp. 66-70.
2. Gudim A. I., Aldushin A. V., Novozhilov O. A. Osobennosti vertikal'nogo raspredeleniia riapushki Coregonus albula (L., 1958) ozera Vishtynetskogo letom 2022 i 2023 gg. [Features of the vertical distribution of the grouse Coregonus albula (L., 1958) of Lake Vishtynetsky in the summer of 2022 and 2023.]. Kompleksnye issledovaniia v rybokhoziaistvennoi otrasli: materialy IX Mezhdunarodnoi nauchno-tekhnicheskoi konferentsii studentov, aspirantovi molodykh uchenykh (Vladivostok, 24 noiabria 2023 g.). Vladivostok, Izd-vo Dal'nevostoch. gos. tekhn. rybokhoziaistv. un-ta, 2024. Pp. 27-34.
3. Aldushin A. V. Prostranstvenno-vremennaia dina-mika pelagicheskogo ikhtiotsenoza oligotrofnogo ozera na primere ozera Vishtynetskogo. Dissertatsiia … kand. biol. nauk [Spatial and temporal dynamics of the pelagic Ichthyocene of an oligotrophic lake on the example of Lake Vishtynetsky. Dissertation ... cand. Biol. sciences]. Kali-ningrad, 2021. 160 p.
4. Aldushin A., Shibaev S. Prospects of Development of Small-Scale Fisheries of Vendace in Lake Vistytis, Kalinin-grad Oblast, Russia. Sustainable Fisheries and Aquaculture: Challenges and Prospects for the Blue Bioeconomy. Envi-ronmental Science and Engineering. Cham, Springer, 2022. Pp. 85-96. Available at: https://doi.org/10.1007/978-3-031-08284-9_9 (accessed: 29.03.2024).
5. Ob utverzhdenii pravil rybolovstva dlia Zapadnogo rybokhoziaistvennogo basseina: prikaz Minsel'khoza Rossii ot 21 oktiabria 2020 g. № 620 (red. ot 21 sentiabria 2023 g.) [On the approval of fishing rules for the Western Fisheries Basin: Order of the Ministry of Agriculture of the Russian Federation dated October 21, 2020 No. 620 (ed. dated September 21, 2023)]. Available at: https://docs.cntd.ru/document/573191354 (accessed: 29.03.2024).
6. Informatsiia ob osvoenii vydelennykh kvot [In-formation on the development of allocated quotas]. Zapadno-Baltiiskoe territorial'noe upravlenie Federal'nogo agentstva po rybolovstvu. Available at: http://zbtu39.ru/informacziya-ob-osvoenii-vydelennyh-kvot/ (accessed: 29.03.2024).
7. Mel'nikov A. V., Mel'nikov V. N. Ulov na usilie i ulavlivaemost' kak otnositel'nye pokazateli promyslovogo usiliia [Catch per effort and trappability as relative indicators of fishing effort]. Vestnik Astrakhanskogo gosudarstvennogo tekhnicheskogo universiteta. Seriia: Rybnoe khoziaistvo, 2011, no. 1, pp. 36-40.
8. Kriksunov E. A., Chistov S. V., Vasil'ev P. V., Bur-menskii V. A., Bobyrev A. E., Mel'nik M. M. Pro-stranstvenno-vremennaia dinamika ryb Pskovskogo ozera [Spatial and temporal dynamics of the fish of Lake Pskov]. Zhurnal obshchei biologii, 2020, vol. 81, no. 1, pp. 1-18.
9. Degtev A. I. Programmno-tekhnicheskaia realizatsiia gidroakusticheskogo metoda kolichestvennoi otsenki plotnosti vodnykh biomass. Dissertatsiia … kand. tekhn. nauk [Software and technical implementation of the hy-droacoustic method for quantifying the density of aquatic biomass. Dissertation ... Candidate of Technical Sciences]. Petrozavodsk, 2004. 168 p.
10. Aldushin A. V., Shibaev S. V. Gidroakusticheskie issledovaniia pelagicheskogo ikhtiotsenoza ozera Vishty-netskogo Kaliningradskoi oblasti [Hydroacoustic studies of the pelagic ichthyocenosis of Lake Vishtynetsky in the Kaliningrad region]. Biologiia vnutrennikh vod, 2016, no. 4, pp. 54-63.
11. Gudim A. I., Aldushin A. V. Osobennosti verti-kal'nogo raspredeleniia riapushki (Coregonus albula (L.)) ozera Vishtynetskogo letom 2022 goda [Features of the vertical distribution of grouse (Coregonus albula (L.)) of Lake Vishtynetsky in the summer of 2022]. Vestnik molodezhnoi nauki, 2023, no. 3 (40), p. 13. DOI:https://doi.org/10.46845/2541-8254-2023-3(40)-41-41.
